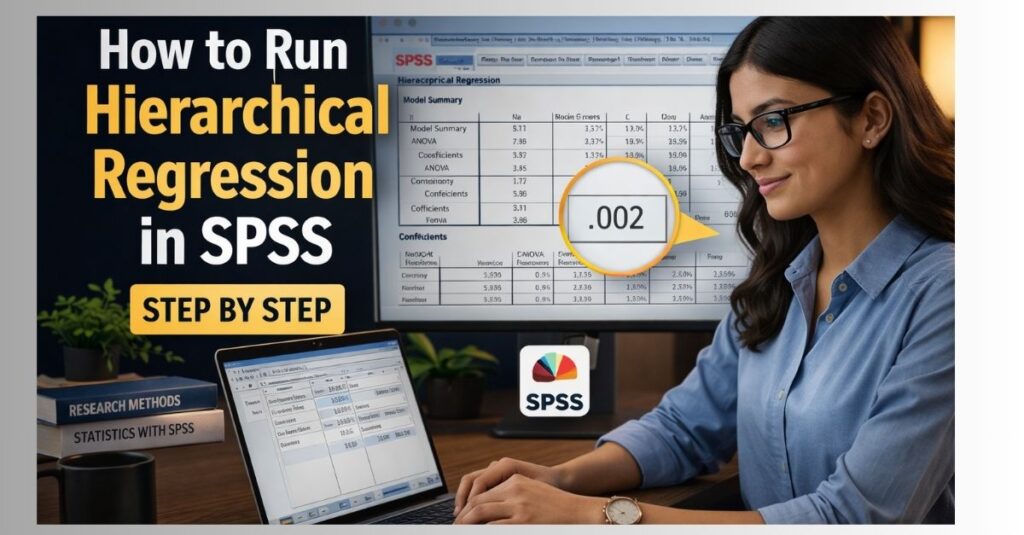
How to Run Hierarchical Regression in SPSS
Hierarchical regression is one of the most useful methods in SPSS for researchers who want to examine how different sets of variables explain an outcome in stages. If you are trying to understand how to run hierarchical regression in SPSS, the key idea is simple: variables are entered into the model in blocks, based on theory, research goals, or logical order, so you can see how much each block adds to the prediction of the dependent variable.
This makes hierarchical regression especially valuable in dissertations, theses, healthcare research, psychology studies, business projects, and education research where the researcher wants to control for some variables first and then test whether additional predictors improve the model. Instead of entering all predictors at once, hierarchical regression allows you to build the model step by step and assess the unique contribution of each block.
For spssdissertationhelp, this topic should remain clearly distinct from Multiple Regression in SPSS, Linear Regression in SPSS, and Logistic Regression in SPSS so the content stays focused and avoids keyword cannibalization. This page is specifically about hierarchical regression in SPSS, including when to use it, how to set up the data, what assumptions to check, the exact steps to follow, and how to interpret the output correctly.
What Is Hierarchical Regression in SPSS?
Hierarchical regression is a type of multiple regression where predictors are entered into the model in a planned order. The order is decided by the researcher, not by the software. This is what makes hierarchical regression different from standard or simultaneous multiple regression, where all predictors are entered at the same time.
The purpose of hierarchical regression is not just to identify significant predictors, but to test whether one set of variables explains additional variance in the dependent variable after earlier variables have already been controlled. This is especially useful when the researcher wants to answer questions such as whether demographic variables explain the outcome first, and whether psychological or behavioral variables still add predictive value after that.
For example, a researcher studying academic performance may enter age and gender in Model 1, then study habits in Model 2, and finally motivation in Model 3. This structure allows the researcher to see how much each block contributes to the prediction of performance.
When Should You Use Hierarchical Regression?
Hierarchical regression is appropriate when your study includes:
- one continuous dependent variable
- two or more predictor variables
- a theoretical or logical reason for entering variables in stages
- a goal of testing the additional contribution of later blocks after controlling for earlier ones
Common examples include:
- predicting academic performance after controlling for demographic variables first
- predicting anxiety while entering background variables before coping variables
- predicting customer satisfaction after controlling for income and age, then adding service quality variables
- predicting employee performance after entering experience first, then training, then motivation
If your goal is simply to assess the joint effect of several predictors at once, then Multiple Regression in SPSS may be enough. If your dependent variable is categorical rather than continuous, then Logistic Regression in SPSS may be more appropriate.
Why Researchers Use Hierarchical Regression
One major advantage of hierarchical regression is that it gives the researcher control over the model-building process. In many studies, some variables should be entered first because they are basic controls, such as age, gender, or baseline score. Other variables may reflect the main theory of interest and should be entered later so their added value can be tested properly.
Another strength is that hierarchical regression allows researchers to evaluate change in R square across models. This tells you whether the new block of variables meaningfully improves prediction after earlier variables have already been included.
This method is especially useful in dissertation work because supervisors often want students to justify the contribution of each group of predictors. Hierarchical regression helps answer not only whether predictors matter, but whether they matter above and beyond earlier controls.
Assumptions of Hierarchical Regression in SPSS
Before running hierarchical regression in SPSS, researchers should check the assumptions carefully. A correct result depends on more than following the software steps.
1. Continuous dependent variable
The dependent variable should be continuous, such as test scores, income, blood pressure, satisfaction scores, or performance ratings treated as scale data.
2. Linear relationship
Each predictor should have a reasonably linear relationship with the dependent variable. Scatterplots can help assess this.
3. Independence of errors
The residuals should be independent. In SPSS, the Durbin-Watson statistic can help assess this, especially when relevant.
4. Homoscedasticity
The variance of residuals should be reasonably constant across levels of predicted values.
5. Normality of residuals
The residuals should be approximately normally distributed. Histograms and P-P plots can help assess this.
6. No serious multicollinearity
Predictors should not be too highly correlated with each other. Tolerance and VIF values are commonly used to assess this.
7. No extreme outliers
Very unusual cases can distort the regression equation. Researchers should inspect standardized residuals, Cook’s distance, and leverage values where needed.
8. Adequate sample size
Hierarchical regression works best when the sample size is large enough relative to the number of predictors included in the model.
Data Setup for Hierarchical Regression in SPSS
Your data should be organized with:
- one column for the dependent variable
- one column for each predictor variable
- one row for each participant or observation
A simple example looks like this:
| Participant | Performance | Age | Gender | Study_Hours | Motivation |
|---|---|---|---|---|---|
| 1 | 72 | 20 | 1 | 12 | 28 |
| 2 | 68 | 22 | 0 | 10 | 24 |
| 3 | 80 | 21 | 1 | 15 | 31 |
| 4 | 75 | 23 | 0 | 13 | 29 |
In this example:
- Performance is the dependent variable
- Age and Gender could be Block 1
- Study_Hours could be Block 2
- Motivation could be Block 3
Make sure scale variables are correctly defined in SPSS and categorical predictors are coded appropriately before analysis.
Request Quote Now
How to Run Hierarchical Regression in SPSS Step by Step
These are the steps the client should follow in SPSS.
Step 1: Open your dataset
Launch SPSS and open the file containing your dependent variable and all predictor variables.
Step 2: Check variable types
In Variable View, confirm that the dependent variable is defined as scale and that your predictors are coded correctly. Continuous predictors should usually be set as scale, while dummy-coded categorical predictors should be checked for correct coding.
Step 3: Open the regression menu
Click Analyze, then Regression, then Linear.
Step 4: Move the dependent variable
Place your outcome variable into the Dependent box.
Step 5: Enter the first block of predictors
Move the first set of predictors into the Independent(s) box. These are usually control variables or background factors.
Step 6: Create the next block
Click Next in the dialog box. This opens a second model. Add the second block of predictors that you want to test after controlling for Block 1.
Step 7: Add more blocks if needed
If you have a third or fourth block, click Next again and enter those predictors in the planned order.
Step 8: Request statistics
Click Statistics and check the options that are most useful, including:
- Estimates
- Model fit
- R squared change
- Descriptives
- Part and partial correlations
- Collinearity diagnostics
- Durbin-Watson
Step 9: Request plots if needed
Click Plots if you want residual plots for assumption checking. You may request standardized predicted values against standardized residuals.
Step 10: Save residuals if required
Under Save, you can request standardized residuals, predicted values, or Cook’s distance for diagnostic purposes.
Step 11: Run the analysis
Click OK. SPSS will generate the output for each block in the hierarchical model.
How to Decide the Order of Blocks
One of the most important parts of hierarchical regression is deciding the order of entry. The order should be based on theory, prior research, or a clear methodological reason, not guesswork.
A common structure is:
- Block 1: control variables such as age, gender, income, or baseline score
- Block 2: core predictors such as behaviors, exposures, or interventions
- Block 3: psychological or advanced explanatory factors
- Block 4: interaction terms, where appropriate
For example, if a researcher wants to know whether study habits predict academic performance beyond age and gender, age and gender should go in the first block and study habits should go in the second block. This allows a clear test of whether study habits explain additional variance after the controls are already included.
In dissertation writing, this ordering should always be justified. A brief explanation of why each block was entered in that sequence strengthens the credibility of the analysis.
Key SPSS Output Tables to Interpret
SPSS usually provides several tables when hierarchical regression is run. These are the most important ones.
Variables Entered/Removed
This table shows which predictors were entered at each model stage. It confirms the block structure of the analysis.
Model Summary
This table is central because it shows R, R square, adjusted R square, standard error of the estimate, and most importantly R square change across blocks.
ANOVA Table
This table shows whether each regression model is statistically significant overall.
Coefficients Table
This table is one of the most important because it shows the unstandardized coefficient, standardized beta, t-value, significance value, and collinearity statistics for each predictor.
Collinearity Statistics
Tolerance and VIF values help determine whether multicollinearity is a problem.
Residual Diagnostics
Plots and diagnostics help assess assumptions such as normality, homoscedasticity, and outliers.
Example of a Hierarchical Regression Output Table
Model Summary Table
| Model | R | R Square | Adjusted R Square | R Square Change | F Change | Sig. F Change |
|---|---|---|---|---|---|---|
| 1 | .35 | .12 | .09 | .12 | 3.50 | .035 |
| 2 | .52 | .27 | .22 | .15 | 5.40 | .007 |
| 3 | .61 | .37 | .31 | .10 | 4.90 | .012 |
In this example, Model 1 explains 12 percent of the variance in performance. After adding the second block, the model explains 27 percent, meaning the second block contributes an additional 15 percent. After the third block, the model explains 37 percent, meaning the final block contributes an extra 10 percent.
Coefficients Table
| Predictor | B | Std. Error | Beta | t | Sig. |
|---|---|---|---|---|---|
| Age | .25 | .11 | .18 | 2.27 | .027 |
| Gender | -1.80 | .95 | -.14 | -1.89 | .064 |
| Study_Hours | 1.10 | .28 | .33 | 3.93 | .000 |
| Motivation | .72 | .21 | .29 | 3.43 | .001 |
This table suggests that study hours and motivation significantly predict performance, while age is also significant and gender is not significant in the final model.
How to Interpret Hierarchical Regression Results
Suppose your dependent variable is academic performance, and you entered age and gender in Model 1, study hours in Model 2, and motivation in Model 3. The interpretation should focus on both model improvement and individual predictors.
A clear interpretation could read:
“A hierarchical multiple regression was conducted to examine whether study hours and motivation predicted academic performance after controlling for age and gender. Age and gender explained 12% of the variance in performance in Model 1, R² = .12, F(2, 47) = 3.50, p = .035. After study hours were added in Model 2, the model explained an additional 15% of the variance, ΔR² = .15, ΔF(1, 46) = 5.40, p = .007. With motivation entered in Model 3, a further 10% of the variance was explained, ΔR² = .10, ΔF(1, 45) = 4.90, p = .012. In the final model, study hours and motivation remained significant positive predictors of performance.
This interpretation works because it explains what happened at each block and highlights the meaning of the change in explained variance.
How to Report Hierarchical Regression in APA Style
A concise APA-style example is:
“A hierarchical multiple regression was performed to determine whether study hours and motivation predicted academic performance after controlling for age and gender. Age and gender were entered in Step 1 and explained a significant proportion of variance in performance, R² = .12, F(2, 47) = 3.50, p = .035. Study hours entered at Step 2 explained an additional 15 percent of the variance, ΔR² = .15, F change(1, 46) = 5.40, p = .007. Motivation entered at Step 3 explained a further 10 percent of the variance, ΔR² = .10, F change(1, 45) = 4.90, p = .012.”
If needed, follow this with the key beta coefficients from the final model.
Common Mistakes to Avoid
Many students lose marks because of avoidable hierarchical regression errors. These include:
- entering variables in blocks without theoretical justification
- confusing hierarchical regression with standard multiple regression
- focusing only on significant predictors and ignoring R square change
- failing to report what each block contributed
- ignoring multicollinearity diagnostics
- interpreting unstandardized and standardized coefficients incorrectly
- not checking assumptions
- reporting p = .000 instead of p < .001
When Hierarchical Regression Is Better Than Standard Multiple Regression
Hierarchical regression is better than standard multiple regression when the order of predictors matters. If you need to show whether later variables explain additional variance after controlling for earlier variables, hierarchical regression is the stronger choice.
Standard multiple regression is useful when all predictors are entered at the same time and no block structure is needed. Hierarchical regression is more appropriate when the research question involves staged prediction, theoretical control, or added explanatory power.
This distinction is useful both for SEO and for user intent. Someone searching for how to run hierarchical regression in SPSS wants more than a general regression guide. They usually want to know how to enter variables in blocks, test R square change, and explain the additional value of later predictors.
Final Practical Checklist for Clients
Before running hierarchical regression in SPSS, the client should confirm all of the following:
- I have one continuous dependent variable
- I have two or more predictor variables
- I have a clear reason for the order in which predictors will be entered
- I know which variables belong in Block 1, Block 2, and later blocks
- I checked the assumptions of linear regression
- I requested R squared change and collinearity diagnostics
- I understand that the main value of hierarchical regression is comparing models across steps
- I know how to interpret the final coefficients and the change in explained variance
FAQ
What does hierarchical regression do in SPSS?
Hierarchical regression examines how much additional variance in the dependent variable is explained when predictors are entered in blocks.
What is the difference between hierarchical regression and multiple regression?
Hierarchical regression is a form of multiple regression where the researcher enters predictors in a planned order to test the contribution of each block.
When should I use hierarchical regression?
Use it when you want to control for some variables first and then test whether later predictors improve the model.
What is the most important table in hierarchical regression?
The Model Summary table is especially important because it shows R square and R square change across models.
Why is R square change important?
It tells you how much additional variance is explained by each new block of predictors after the earlier blocks have been controlled.
What assumptions should be checked?
Researchers should check linearity, independence of errors, homoscedasticity, normality of residuals, multicollinearity, and outliers.
Can I use categorical predictors in hierarchical regression?
Yes, but they usually need to be coded appropriately, such as through dummy coding.
Is hierarchical regression suitable for dissertation research?
Yes. It is widely used in psychology, education, healthcare, business, and social science dissertations.
Can spssdissertationhelp help with hierarchical regression output?
Yes. We can help with SPSS dissertation help, regression assumptions, output interpretation, APA reporting, and dissertation results writing.
Closing Paragraph
If you want to learn how to run hierarchical regression in SPSS correctly, the key is to focus on model building, not just the menu path. A strong hierarchical regression analysis requires a clear block structure, theoretical justification for the order of entry, proper assumption checking, and accurate interpretation of both coefficients and R square change. When explained well, hierarchical regression can strengthen a dissertation by showing exactly how different sets of predictors contribute to the outcome. For students and researchers who need accurate support, this topic fits naturally within the wider services offered by spssdissertationhelp.