

Reviewed by Pius, R and RStudio Tutor · Updated July 2026 · 11 min read
The R Error That Sends Most Students to Us
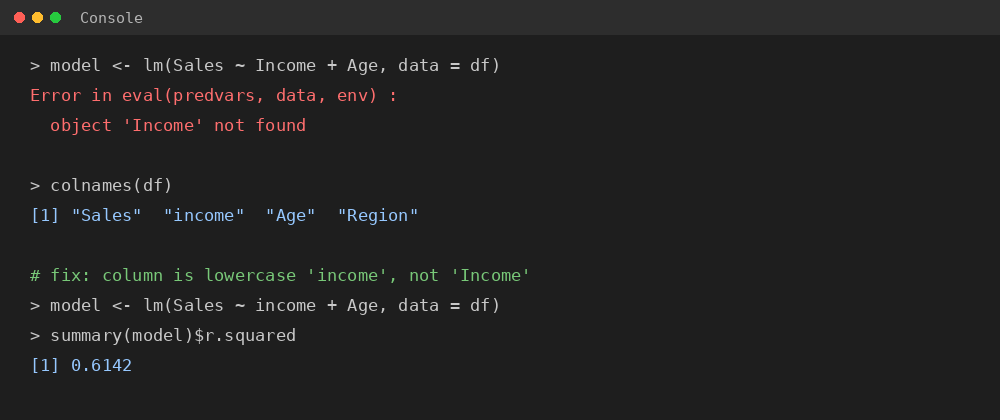
Not “students find R challenging.” It’s the actual moment something breaks. A student sends over a script that throws:
Error in eval(predvars, data, env) : object 'income' not found
The variable is actually called Income with a capital I, or it’s still stored as a factor when the model expects numeric. Small thing. Costs two hours if you’re debugging alone at midnight before a deadline, because R’s error messages tell you what failed but rarely why.
That’s the kind of problem R Studio assignment help exists for. Not “I don’t understand statistics,” but “my code is right conceptually and still won’t run,” or “it runs, but I can’t explain why I chose this test over another one.” Both are common, and both are fixable faster with someone who has already hit the same wall.
What R Studio Assignment Help Actually Covers
R and RStudio have become standard tools in statistics, data science, psychology, economics, public health, and business programmes, partly because R is free, partly because it produces reproducible output that SPSS point-and-click workflows don’t. That reproducibility is also what makes R assignments harder than they look on paper. A menu-driven tool hides the logic behind a click; R makes you write the logic out, which means every assumption you’re making is visible, including the wrong ones.
R Studio assignment help means working through that logic with you: choosing the right test for your data structure, writing code that actually runs without silent errors, checking the assumptions a method depends on, and explaining the output in language you could defend in a viva. It is not just producing a script and sending it back. A script with no explanation attached teaches you nothing and leaves you unable to answer a single follow-up question about your own submission.
Common Mistakes That Cost Marks
Most of the marks lost on R assignments are not conceptual. They come from a short list of recurring issues:
Wrong variable type going into a model. A categorical variable read in as character or numeric instead of factor changes how lm() or glm() treats it entirely. R will often run the model anyway and give you a wrong answer silently, which is worse than an error.
Skipping assumption checks. Running a t-test or ANOVA without checking normality or variance homogeneity first, then reporting the result as if the test’s assumptions were automatically satisfied. Graders check for this specifically.
Using paired = FALSE (the default) on paired data, or the reverse. This single argument changes the test’s degrees of freedom and p-value, and it is one of the most common silent errors in a t.test() call.
Not setting set.seed() before any random process, including train/test splits, bootstrapping, or simulation. Without it, your results are not reproducible, and a grader rerunning your script will get different numbers than the ones in your report.
Misreading summary(model) output, particularly confusing a coefficient’s p-value with the model’s overall significance, or misinterpreting R squared as a measure of whether the model is “correct” rather than how much variance it explains.
Multicollinearity in regression models with several predictors, left unchecked because the model still runs and produces coefficients. car::vif() takes one line and catches this before it becomes a problem in your interpretation.
Copying code without understanding what each function argument does, which becomes obvious the moment a grader or viva examiner asks “why did you use this argument here.”
How I Work on Your Assignment
Step one: you send the assignment brief, dataset, and rubric. I read the rubric before touching the data, since marks are almost always attached to specific things: interpretation, assumption checks, or visualization quality. I scope the work against those criteria, not a generic checklist that might miss what your course is actually grading.
Step two: I flag anything off before starting. Wrong test implied by the brief, a variable missing from the dataset, a rubric requirement that contradicts the data you were given. This happens more often than you’d expect, and catching it early saves a rewrite later.
Step three: I write and test the script, with inline comments explaining why a function or argument was used, not just restating what the line does. A comment like # check for multicollinearity before trusting coefficients teaches you something; # run vif function does not.
Step four: you get the code, the output, and a plain-language explanation you could use to answer a viva or a follow-up question about your own submission. If your course requires a knitted report rather than a raw script, I match the output format your rubric specifies, since a PDF, HTML, and Word output from the same R Markdown file can each break in different ways.
Where I Help Most Often
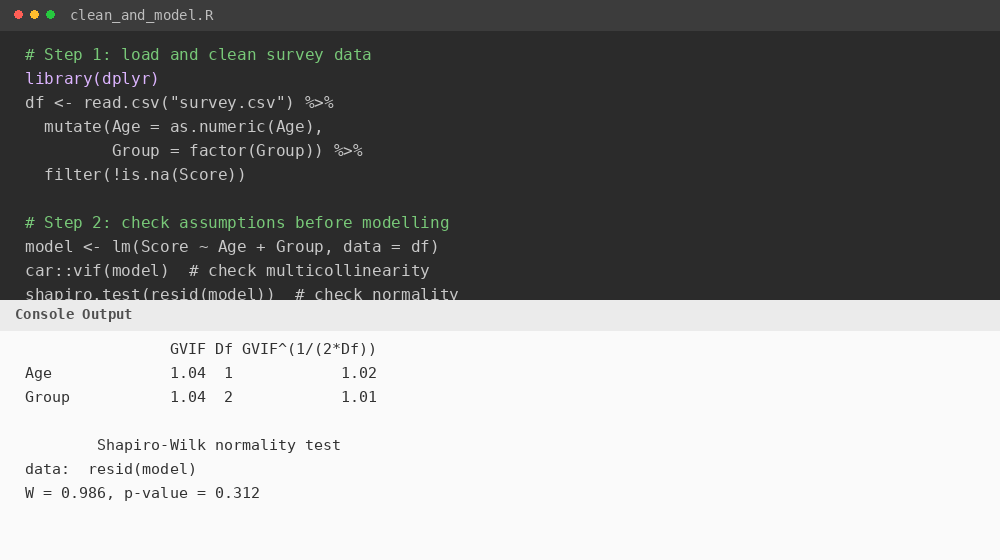
Data cleaning. Real datasets rarely arrive analysis-ready. Missing values coded as blank strings instead of NA, dates stored as text, categorical variables with inconsistent capitalization (“Male” vs. “male”). A typical cleaning step looks like this:
df <- read.csv("survey.csv") %>% mutate(Age = as.numeric(Age), Group = factor(Group)) %>% filter(!is.na(Score))
That one pipeline fixes three separate problems: forces Age into a numeric type, converts Group into a proper factor for modeling, and drops rows missing the outcome variable. Skipping any one of these steps produces a model that runs without error and gives you the wrong answer. Packages used: dplyr, tidyr, janitor.
Descriptive statistics. Choosing the right summary statistic for the shape of your data, not defaulting to mean and standard deviation when the distribution is skewed. Packages used: psych, summarytools.
Hypothesis testing. Independent versus paired t-tests, one-way versus two-way ANOVA, parametric versus non-parametric alternatives when normality fails. Packages used: stats, rstatix.
Regression analysis. Linear, logistic, and multiple regression, with assumption checks run before interpretation, not after. Packages used: stats, car, lmtest.
Time series analysis. Checking for stationarity before fitting a model, since forecasting on non-stationary data without differencing produces misleading trend estimates. Packages used: forecast, tseries.
Data visualization. Charts that support the statistical finding rather than decorate the page: correctly labeled axes, an appropriate chart type for the variable type, and annotations that highlight what the reader should notice. Package used: ggplot2.
R Markdown and Quarto reports. Reproducible documents where code, output, and narrative live in one file. Common failure points here include code chunks that knit cleanly to HTML but break on PDF export, and cross-references that silently fail when a chunk is renamed. Packages used: rmarkdown, knitr.
A Worked Example: Regression Assumption Checks
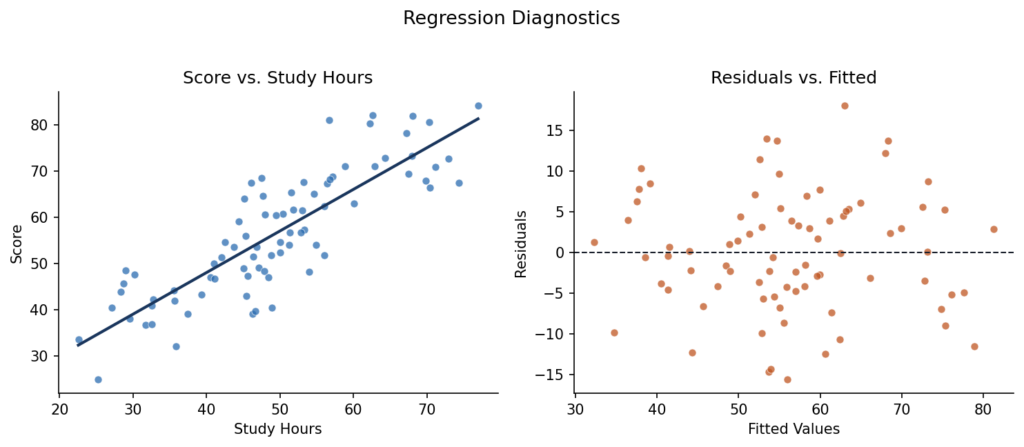
Since assumption checking is where most marks quietly disappear, here is what a proper check looks like in practice, using a simple linear model of exam score against study hours.
After fitting model <- lm(Score ~ StudyHours, data = df), three checks matter before you trust the coefficients. First, car::vif(model) for multicollinearity, which only matters once you have more than one predictor, but is worth checking by habit. Second, a residuals versus fitted plot, generated with plot(model, which = 1), to check that residuals scatter randomly around zero rather than fanning out or curving, which would signal heteroscedasticity or a missing non-linear term. Third, shapiro.test(resid(model)) to check whether residuals are approximately normally distributed, which the standard errors and p-values depend on.
None of this changes the coefficient estimates. What it changes is whether you are entitled to trust the p-values and confidence intervals attached to them, which is usually exactly what a rubric is checking when it asks you to “justify your model.”
Academic Fields I Support
R is used differently depending on the discipline, and the write-up conventions differ with it. I work most often with:
Statistics and data science programmes, where the emphasis is usually on method choice and code correctness.
Psychology and social sciences, where Likert-scale data and survey reliability measures like Cronbach’s alpha come up constantly, and where non-parametric tests are often required because ordinal data violates the assumptions of standard parametric tests.
Public health and epidemiology, where survival analysis, logistic regression for binary outcomes, and confidence intervals reported alongside effect sizes are standard expectations.
Economics and finance, where time series methods, panel data models, and forecasting accuracy metrics dominate.
Business analytics, where the write-up often needs to translate statistical output into a plain-language business recommendation, which is a different skill from the statistics itself.
Each assignment gets handled with the field’s conventions in mind. The underlying glm() call for a logistic regression looks similar whether you’re predicting disease outcome or customer churn, but how you report and interpret it does not.
Is This Actually Allowed?
Most universities’ academic integrity policies distinguish between submitting someone else’s work as your own and getting tutoring or technical support to understand and complete your own work. It’s the same distinction that covers a writing center, a TA’s office hours, or a private tutor. Check your specific institution’s policy if you’re unsure, since they vary by school and sometimes by department. What I won’t do is complete work anonymously with no explanation attached, since every deliverable comes with commentary so you can actually account for the choices made in it if asked.
FAQs
Yes. A large share of requests are exactly this. I annotate
summary() output, ANOVA tables, and diagnostic plots line by line so you can explain them yourself afterward. Both. If your rubric wants a knitted report, tell me the target format (PDF, HTML, or Word), since output formatting has its own failure points, like
kableExtra tables that render fine in HTML but break in PDF export. I flag this before starting analysis, not after. If a rubric assumes clean data and yours isn’t, that’s a conversation to have upfront, not a surprise buried in the results section.
That’s fine. Send the brief and let me know which part you need, and I’ll scope it to just that.
Yes, this comes up often when a student inherited code from a previous course or a group project and needs to understand it before building on it.
This is one of the most common requests. Send the script and the error message, and I’ll walk through what’s actually failing rather than rewriting it from scratch.
Related Help
SPSS Assignment Help, for coursework specifying SPSS instead of R.
Quantitative Data Analysis Help, for larger datasets or multi-method research designs.
SPSS Statistics Help, for output interpretation and explanation.
Get Help With Your R Studio Assignment
Send your assignment brief and dataset for a free quote.