Time Series Analysis in SPSS: A Complete Guide for Research, Forecasting, and Academic Writing
Time series analysis in SPSS is a practical method for studying data collected over time. It helps researchers, students, and analysts understand whether values are rising, falling, repeating in cycles, or responding to important events. When the same variable is measured across months, quarters, weeks, or years, the order of the observations matters. That is exactly where time series analysis becomes useful.
Many research projects include data that changes over time, yet the analysis is often limited to simple averages or ordinary graphs. That approach can miss the deeper pattern in the data. A time series model makes it possible to examine long-term movement, repeated seasonal behavior, short-term fluctuations, and even the likely direction of future values. This adds far more value than a basic descriptive summary.
SPSS is a good choice for this kind of work because it gives users a structured, menu-based environment for exploring time-dependent data. You do not need advanced programming knowledge to begin, but you do need a clear understanding of the logic behind the method. Once that is in place, SPSS becomes a powerful tool for dissertations, reports, and practical forecasting.
If you need broader support while working on your study, you can also explore our SPSS dissertation help, data analysis help, and dissertation methodology help pages.
What Time Series Analysis Means
Time series analysis is the study of observations recorded in time order. Unlike cross-sectional analysis, where different people or groups are measured at one point, time series analysis follows one outcome across repeated periods. The method treats time as part of the structure of the data rather than just a label attached to the rows.
This matters because values recorded at one point are often related to values recorded earlier. Monthly sales this month may be influenced by sales last month. Inflation this year may be linked to inflation last year. Hospital admissions this week may reflect a pattern that has been building for several weeks. Time series analysis helps uncover that structure and explain what it means.
A good time series analysis can identify whether there is a general upward or downward movement, whether certain periods repeat a pattern, whether the series changes sharply after an event, and whether future values can be estimated from past behavior. In academic research, that makes the method highly valuable because it gives depth to the results and discussion chapters.
Why Time Series Analysis Matters
Time-based data appears in many fields, including business, economics, healthcare, education, social science, and policy research. In each case, the researcher is usually interested in more than just the values themselves. The real question is how those values behave over time. Do they increase steadily, move in cycles, respond to interventions, or fluctuate unpredictably?
That is why time series analysis matters. It allows the researcher to study change in a way that reflects the real structure of the data. A list of monthly observations may look ordinary at first, but once the time order is examined properly, useful patterns often emerge. This is especially important when decisions depend on whether an outcome is improving, worsening, or reacting to an outside change.
In academic writing, this method strengthens the credibility of the analysis because it shows that the statistical procedure fits the nature of the data. Instead of forcing time-based observations into methods that ignore sequence, the researcher uses a technique designed specifically for repeated measurements over time. That often leads to more meaningful interpretation and stronger conclusions.
When to Use Time Series Analysis in SPSS
You should use time series analysis when the same variable is observed repeatedly across regular intervals and the order of those observations is important. The intervals should be consistent, such as daily, weekly, monthly, quarterly, or yearly. If the spacing is irregular, the analysis becomes more difficult and may require extra preparation.
This method is especially appropriate when the research question focuses on change. You may want to know whether revenue is growing, whether unemployment is declining, whether website visits rise at certain points each year, or whether a policy changed the pattern of an outcome. In each of these cases, the sequence of observations is central to the analysis.
SPSS is useful here because it offers several practical forecasting and modeling options within a user-friendly environment. Students often choose it because they need output that can be interpreted and reported clearly in dissertations and assignments. Analysts use it because it offers a straightforward way to examine pattern, trend, and forecast without writing code.
Common Examples of Time Series Data
Time series data is common in research and applied work. A business may track monthly sales, weekly demand, or yearly profit. An economist may study annual GDP, quarterly inflation, or monthly unemployment. A public health researcher may analyze daily infection counts or monthly hospital admissions. An education researcher may examine yearly enrollment or term-based academic performance.
The method is also useful in policy evaluation. A government may introduce a road safety law, tax reform, or health campaign and then observe the outcome for months or years before and after the change. In such a case, the time pattern is essential because the researcher needs to know whether the intervention shifted the series in a meaningful way.
These examples show why time series methods are valuable. The goal is not only to list what happened, but to understand how the outcome behaved across time and whether that behavior supports the research question being asked.
Main Components of a Time Series
A time series usually contains one or more major components. The first is trend, which refers to the general long-term direction of the series. If values rise steadily across many periods, the series has an upward trend. If they fall, it has a downward trend. Some series remain fairly stable, while others show strong long-term movement.
The second component is seasonality. This occurs when a pattern repeats at fixed intervals. Retail sales may rise every December, tourism may peak during holiday seasons, and energy consumption may change with weather cycles. Seasonal behavior is common in monthly and quarterly data.
The third component is irregular movement. These are the short-term fluctuations that do not follow a clear pattern. They may be caused by temporary events, shocks, or random variation. Some researchers also discuss cyclical movement, which reflects longer-term waves that do not repeat at a strictly fixed interval.
Understanding these components helps you choose the right SPSS procedure and interpret your output more clearly. A series with strong seasonality should not be treated the same way as one that only shows a long-term trend.
Preparing Data Before Analysis
Strong results begin with clean data. Before you run any procedure in SPSS, make sure the observations are sorted from the earliest period to the latest. Each row should represent one time point only, and the spacing between periods should be consistent. If one row is January and the next is March, a missing February may affect the analysis and needs attention.
You should also check for duplicate periods, missing values, and obvious input errors. Time series models can be sensitive to data problems because every observation is part of a sequence. If one value is entered incorrectly, it can distort the pattern and reduce forecast quality.
A visual inspection is also helpful before formal analysis. A line chart can quickly show whether the series is trending upward, moving seasonally, changing suddenly, or behaving erratically. This early step often reveals issues that are not obvious from the raw data table. Good preparation saves time later and makes the final interpretation much more convincing.
Time Series Analysis in SPSS for Research Projects
For many students, time series analysis in SPSS becomes important when their dissertation or thesis involves sequential data. It may be a study of market prices, health indicators, business performance, institutional outcomes, or public policy changes. In each case, the method can strengthen the analysis chapter because it does more than summarize. It explains movement.
In Chapter 3, the method is justified because the data is collected at regular intervals and the study focuses on trend, change, or forecasting. Chapter 4 presents the results using graphs, model summaries, and clear interpretation of the main patterns. Chapter 5 then discusses the findings in relation to theory, practical application, or policy implications.
This makes time series analysis a strong choice for researchers who want their statistical work to match the structure of the data closely. It is not just a technical tool. It is also a way of making the research more coherent and more useful.
How to Run Time Series Analysis in SPSS
Many people want a clear answer to the question of how to run time series analysis in SPSS. The process becomes much easier when it is broken into practical steps. The goal is to begin with properly ordered data, inspect the pattern visually, choose an appropriate model, and then interpret the output in relation to the research question.
The exact wording of menu options may vary slightly depending on your SPSS version, but the general process stays the same. The first stage is always preparation. The second is visual exploration. The third is model fitting. The fourth is interpretation. Rushing to the model without checking the series first often leads to confusion.
A careful workflow helps avoid mistakes and produces cleaner results. It also makes academic reporting easier because you can explain the procedure in a logical order. That is especially important when the analysis will be reviewed by a supervisor, examiner, or client.
Step-by-Step Guide: How to Do Time Series Analysis in SPSS
Step 1: Open the Dataset and Check the Order
Start by opening your data file in SPSS. Confirm that the observations are arranged in chronological order, from the earliest period to the latest. If the order is wrong, use the sort function before continuing. Time series analysis depends on correct sequencing, so this step should never be skipped.
Look at the time variable carefully. It may be recorded as year, month, quarter, week, or a full date. Make sure it is complete and easy to interpret. Good variable labels make the later output much easier to read and explain.
Step 2: Make Sure Each Row Represents One Time Period
Each row in the dataset should represent one period only. For example, if the series is monthly, each row should be a separate month. If it is quarterly, each row should represent one quarter. Avoid mixing periods or entering repeated values for the same time point.
At this stage, also confirm that the main outcome variable is numeric and free from obvious entry errors. A clean structure is essential because time series procedures assume that the sequence is meaningful and stable.
Step 3: Create a Line Chart
Before fitting any model, create a line chart. In SPSS, go to the graph options and place time on the horizontal axis and the outcome variable on the vertical axis. This simple chart helps you see what the series is doing before you choose a method.
A line chart may reveal trend, seasonal movement, sudden shifts, flat regions, or extreme spikes. It may also show that the data is too irregular for a simple model. In many cases, this visual check tells you more than a table ever could. It is also a useful figure for the final report.
Step 4: Review the Pattern
Once the graph appears, look for the main features. Ask whether the values generally increase or decrease over time. Check whether the same pattern repeats every year, quarter, or month. Notice whether there is a sharp jump or drop at a particular point.
This step matters because it guides your modeling decisions. A series with an upward trend is different from one with seasonality. A series with a sudden interruption may need a different approach from one that changes smoothly over time. Understanding the pattern first makes the next steps more meaningful.
Step 5: Go to the Forecasting Options
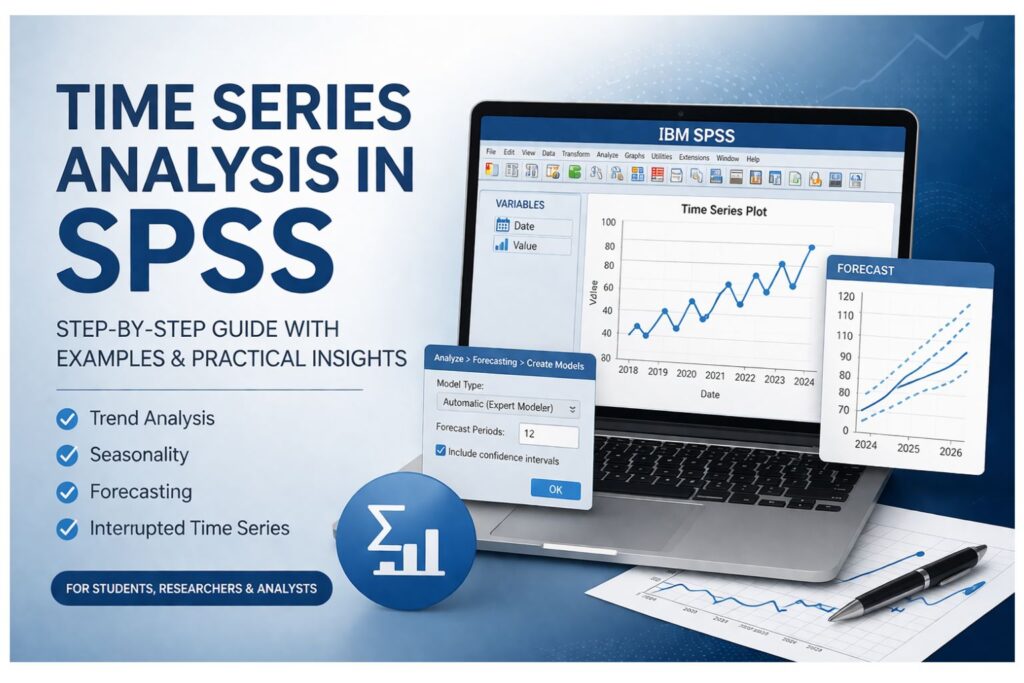
Now move to the modeling stage. In SPSS, go to Analyze > Forecasting. Depending on the version you are using, you may see options such as Create Models, Sequence Charts, Autocorrelations, or ARIMA.
For many users, Create Models is the easiest entry point because it allows SPSS to test the data and suggest a suitable structure. More advanced users may go directly to ARIMA or other specific approaches, but the guided route is often a good starting point for students and general researchers.
Step 6: Select the Series to Be Modeled
Place your main outcome variable into the target or dependent field in the forecasting window. This tells SPSS which variable should be modeled over time. If you have multiple series, begin with one to keep the interpretation simple.
If your study includes a date variable that SPSS needs to recognize, define it clearly. The software must understand the order of the data for the model to be fitted correctly. Careful setup here improves the quality of the output.
Step 7: Choose the Modeling Method
At this stage, you may choose an expert modeler or specify a method manually. The expert modeler is helpful when you want SPSS to evaluate the data and identify a likely model automatically. This is often practical for initial exploration and standard forecasting tasks.
Manual specification gives you more control. If the data shows level, trend, or seasonality, exponential smoothing may be appropriate. If the data shows autocorrelation and needs a more technical structure, ARIMA may be better. The right choice depends on the pattern observed in the data and the purpose of your analysis.
Step 8: Request Predicted Values and Forecasts
If you want to estimate future periods, enter the number of points you want SPSS to forecast. You may also request saved predicted values and residuals. These are useful for checking how well the model fits the existing data and for displaying fitted values against actual values.
Forecast intervals are also valuable because they show the likely range around the prediction. A point forecast alone can look precise, but the interval reminds the reader that future estimates contain uncertainty. This makes the analysis more honest and more academically sound.
Step 9: Run the Model
After confirming the settings, click OK. SPSS will produce a set of results that may include model summaries, fit statistics, parameter estimates, charts, and forecast tables. Take time to review each section carefully rather than jumping straight to the predicted values.
The output is only useful when interpreted properly. A model that produces a forecast is not automatically a good model. The fit, graph, and residual pattern all need attention before the analysis can be trusted.
Step 10: Check the Model Summary
The model summary tells you what SPSS selected or estimated and gives information about how well the model fits the data. Depending on the procedure, you may see statistics such as stationary R-squared, RMSE, or MAPE. These help assess the quality of the model, but they should not be read in isolation.
A good fit is not only about one numerical value. It also depends on whether the model reflects the visible behavior of the series and whether the remaining residuals look random. Numbers are useful, but they should support the larger interpretation rather than replace it.
Step 11: Examine the Fitted and Forecast Graphs
The graph is often the clearest part of the output. Compare the fitted values to the actual values. If the fitted line follows the real series closely, that is usually a positive sign. If it misses major peaks, troughs, or turning points, the model may not be appropriate.
The forecast section should also be reviewed carefully. Ask whether the future pattern seems reasonable in light of the historical data. Forecasts should make practical sense, not just statistical sense. That is especially important when the results will be discussed in a dissertation or report.
Step 12: Check the Residuals
Residuals are the differences between the observed values and the fitted values. In a good model, residuals should not show a clear pattern. They should look random. If the residuals still show trend or seasonality, the model may have failed to capture an important feature of the data.
Many students skip this step, but it is one of the most important. A forecast can appear acceptable at first glance while still leaving a systematic pattern unexplained. Residual review gives you an extra layer of confidence before you interpret the final results.
Step 13: Interpret the Findings Clearly
The last step is interpretation. Explain whether the series shows a trend, repeated seasonal movement, or a stable pattern. If you generated forecasts, describe the projected direction and uncertainty. If the model suggests that values are likely to rise, fall, or remain stable, state that clearly and link it to the context of the study.
This is where statistical analysis becomes useful research. The numbers and charts need to answer the actual question being asked. A good interpretation does not just describe the output. It explains what the output means.
Understanding SPSS Output
SPSS time series output can look technical at first, but it becomes manageable when read in sections. Begin with the model information. This tells you what approach was used and whether the series was treated as having trend, seasonality, autoregressive behavior, or some other structure. That basic information sets the direction for the rest of the interpretation.
Next, read the fit statistics. These show how well the model describes the existing data. Lower prediction errors generally suggest better fit, but the figures should be considered together with the graph and the residual pattern. A model may have acceptable statistics while still failing to represent the series clearly.
After that, move to the charts. The graph often reveals whether the model follows the actual data well. If fitted values move in a way that resembles the real series, interpretation becomes easier and more reliable. If they do not, caution is needed. Good interpretation is always a combination of statistics, visual evidence, and subject knowledge.
Time Series Analysis in SPSS PDF Style Guidance
Some readers look for a time series analysis in SPSS PDF because they want a guide they can save, revise, or follow alongside the software. The most useful kind of guide is one that combines explanation, practical steps, and interpretation advice in one place. That is what makes a time series resource genuinely helpful.
A good reference guide should explain what the method is, when it should be used, how the data should be prepared, what menu options to select, and how the output should be written up. Without those parts working together, the reader may understand the software steps but still struggle to explain the results properly.
This is especially true in dissertation work. Students rarely need only the software procedure. They also need to justify the method, describe what the model shows, and discuss why the findings matter. A full guide should support that entire process rather than just listing menu clicks.
Interrupted Time Series Analysis in SPSS
Interrupted time series analysis in SPSS is useful when there is a known event or intervention that may have changed the pattern of the data. Examples include a new policy, treatment, educational reform, safety campaign, tax change, or public health program. The main purpose is to examine whether the event changed the level of the series, the trend of the series, or both.
This approach is stronger than a simple before-and-after comparison because it respects the pattern that already existed before the interruption. If a variable was already increasing before a policy began, a continued increase afterward may not prove that the policy caused the change. Interrupted time series analysis helps separate the pre-existing trend from the effect of the intervention.
In SPSS, this usually involves creating variables that represent time, the intervention point, and the period after the intervention. These variables can then be used to assess whether the series shifted in a meaningful way. For many applied studies, this becomes one of the most convincing ways to examine real-world change.
Example of Interrupted Time Series Logic
Imagine a hospital introduces a medication safety protocol in January 2024 and wants to know whether monthly medication errors declined afterward. If the error count was already decreasing before the protocol, a simple comparison of the average before and after January may be misleading.
Interrupted time series analysis looks at the slope before the protocol, then checks whether the level dropped immediately after implementation and whether the trend changed in the months that followed. This gives a more informative answer. It may show an immediate drop, a gradual improvement, both, or no meaningful change at all.
The same logic can be applied in education, business, transport, and policy research. A school may introduce a support program, a company may launch a pricing strategy, or a government may enforce a safety regulation. When the event happens at a clear point in time and repeated data is available before and after, interrupted time series becomes highly valuable.
Forecasting Future Values in SPSS
Forecasting is one of the most practical uses of time series analysis. Once a model captures the main structure of the historical series, it can estimate likely future values. This is useful in planning, budgeting, capacity management, and strategic decision-making. Businesses may forecast sales, hospitals may forecast patient demand, and universities may forecast enrollment.
However, forecasts should always be interpreted with care. They are not guarantees. They are evidence-based estimates built from historical patterns. If the future differs sharply from the past because of sudden shocks or new conditions, the forecasts may become less accurate. That is why uncertainty intervals are important.
In an academic report, a good forecast section should explain the time horizon, the predicted direction, and the degree of uncertainty. A short-term forecast is usually more credible than a long-term one. The reader should be able to understand not only what SPSS predicted, but also how cautiously that prediction should be treated.
Common Problems Researchers Face
Many researchers run into difficulty with time series analysis because the data is not prepared properly or the model is interpreted too quickly. One common problem is missing time points. If the sequence has gaps, the pattern may be distorted. Another issue is inconsistency in intervals. Monthly and quarterly values should not be mixed without careful restructuring.
Another common problem is overreliance on automatic output. SPSS can suggest a model, but it is still the researcher’s task to judge whether the result makes sense. A technically fitted model is not enough if it does not reflect the actual pattern or answer the research question well.
Some researchers also ignore outliers or structural breaks. A sudden spike in the series may represent a real event that deserves explanation. If it is simply treated as noise, the interpretation may be incomplete. Others focus only on numerical fit statistics and forget to inspect the graph and residuals. Good time series work requires all of these pieces to be considered together.
Mistakes to Avoid
One major mistake is using time series methods on data that is too short. Very few observations may not provide enough information to detect stable trend or seasonality. Another mistake is failing to create a graph before modeling. Visual inspection often reveals pattern, irregularity, or structural change more quickly than any table.
A third mistake is confusing association with intervention effect. Just because a series changes after a policy does not mean the policy caused the change. That is why interrupted time series methods are important when evaluating events. Another mistake is presenting forecasts without acknowledging uncertainty. Forecasts should always be framed as estimates rather than fixed outcomes.
Finally, many students paste SPSS tables into Chapter 4 without explaining what they mean. That weakens the academic value of the work. The best analysis is not the one with the most tables. It is the one that explains clearly what the data shows and why it matters.
How to Write Time Series Results in a Dissertation
To report time series results well, begin by explaining why the method was appropriate. State that the data was collected at regular intervals and that the aim was to examine trend, forecast future values, or assess the impact of an intervention. This makes the method section more coherent and easier to defend.
Next, describe the dataset briefly. Mention the period covered, the number of observations, the time interval, and the main variable analyzed. Then summarize what the initial graph showed. This is a good place to mention whether the series appeared to have trend, seasonality, or a sudden change.
After that, report the model used and explain the main findings in plain language. State whether the model fit the data reasonably well, whether the forecasts suggested increase or decline, and whether any intervention appeared to shift the level or slope of the series. Keep the explanation connected to the research question throughout.
Writing the Discussion Section
In the discussion chapter, move beyond description and explain what the time pattern means. When the series shows steady growth, explain the possible reasons behind that pattern. If a policy appears to influence the trend, connect the findings to theory, institutional practice, or previous research. Where forecasts indicate future growth or decline, discuss the implications carefully.
The discussion should show that the statistical analysis has practical meaning. It is not enough to say that SPSS found a trend. You should explain what that trend implies for the subject being studied. This is where the value of time series analysis becomes most visible, because the method helps connect numbers to change over time in a way that is easier to understand.
If you need help presenting results and discussion clearly, our Chapter 4 data analysis help and SPSS results interpretation help pages may also be useful.
Why This Topic Is Valuable for Students and Researchers
Time series analysis in SPSS is valuable because it gives structure to repeated data and helps the researcher see more than isolated values. It shows how a variable behaves across time and whether that behavior supports a useful conclusion. For students, this often means a stronger dissertation chapter. For analysts, it means better evidence for planning and decision-making.
The method is especially important when the research focuses on change. Many important questions involve movement over time rather than a single static comparison. Whether the topic is business growth, public health, education performance, or policy impact, time series analysis gives the researcher a more accurate way to explore the evidence.
Used well, it turns chronological data into meaningful explanation. That is why it remains one of the most useful methods for studies built around repeated measurements.
Final Thoughts
Time series analysis in SPSS is a practical and valuable method for studying data collected across time. It helps identify trend, seasonality, structural change, and possible future movement. More importantly, it helps researchers interpret repeated observations in a way that reflects how the data actually behaves.
A strong analysis begins with well-ordered data and careful visual inspection. It continues with a sensible modeling choice, close attention to fit and residuals, and a clear interpretation of what the findings mean. When the study includes a policy or intervention, interrupted time series analysis can add even greater depth by showing whether the event changed the level or slope of the outcome.
For dissertations, reports, and applied projects, this method can make the analysis more credible and more useful. It is not only about running SPSS. It is about understanding change over time and explaining it clearly.
Frequently Asked Questions
What is time series analysis in SPSS?
Time series analysis in SPSS is a method used to study data recorded in time order, such as monthly, quarterly, weekly, or yearly observations. It helps identify patterns such as trend, seasonality, irregular movement, and possible future forecasts.
How do I run time series analysis in SPSS?
Start by arranging the data in chronological order and creating a line chart to inspect the pattern. Then go to the forecasting options in SPSS, choose the variable you want to model, select an appropriate method, and review the model summary, graphs, and residuals before interpreting the results.
How do I do time series analysis in SPSS for a dissertation?
Begin by justifying why the method suits your research question and data structure. Prepare the dataset carefully, run the analysis in SPSS, interpret the pattern clearly, and write the results in plain academic language. The discussion section should explain what the time pattern means in the context of your study.
What is interrupted time series analysis in SPSS?
Interrupted time series analysis in SPSS is used when a known event or intervention may have changed the level or trend of a time-based outcome. It helps assess whether the change happened beyond what would have been expected from the earlier pattern alone.
Can SPSS forecast future values?
Yes. SPSS can estimate future values using forecasting models such as exponential smoothing and ARIMA. These forecasts are based on historical patterns and are most useful when interpreted together with uncertainty intervals.
What kind of data is suitable for time series analysis?
The data should be collected at regular intervals, such as days, weeks, months, quarters, or years. The observations must be in chronological order, and the spacing between them should be consistent.
Why should I create a graph before fitting the model?
A graph helps reveal the overall behavior of the series before analysis. It can show trend, seasonality, outliers, and structural breaks, which makes it easier to choose a suitable model and interpret the results later.
How many observations do I need?
In general, more observations lead to a more reliable analysis. Very short series may not show stable pattern clearly, especially if the goal is forecasting or detecting seasonality. The appropriate number depends on the complexity of the pattern and the purpose of the study.
Is there a time series analysis in SPSS PDF guide?
Many people look for a time series analysis in SPSS PDF guide because they want a resource they can save and follow. A useful guide should explain the method, the SPSS steps, and the interpretation process together rather than giving only a short software tutorial.
Where can I get help with time series analysis in SPSS?
If you need help with data preparation, model selection, interpretation, or dissertation writing, you can explore our SPSS dissertation help, data analysis help, and related academic support pages on spssdissertationhelp.com.