
Students often search for jamovi SPSS when deciding which statistical software to use for a dissertation, thesis, capstone project, research paper, or quantitative assignment. The comparison makes sense because Jamovi and SPSS can both run many common statistical tests, including descriptive statistics, t-tests, ANOVA, correlation, regression, chi-square tests, and reliability analysis.
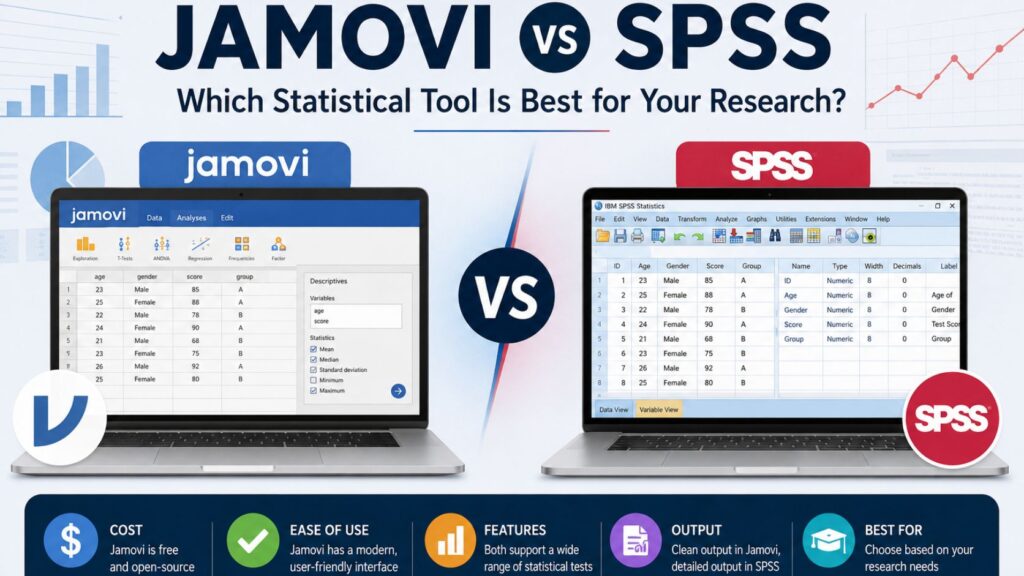
However, Jamovi and SPSS are not the same software. Jamovi is free, open-source, modern, and closely connected to R. SPSS is a long-established commercial statistical package with strong recognition in universities, research departments, and dissertation committees. Jamovi may be easier for beginners who want a simple interface, while SPSS may be safer for students whose supervisors expect traditional SPSS output.
The best choice depends on your research design, supervisor requirements, budget, statistical tests, dataset complexity, and reporting expectations. A simple classroom assignment may work well in Jamovi. A formal dissertation or doctoral project may require SPSS, especially if your department, supervisor, or committee expects SPSS output and syntax documentation.
Need help deciding whether Jamovi or SPSS is right for your dissertation? Our statistical analysis experts can review your research questions, variables, hypotheses, and analysis plan before you run your tests. You can also request professional SPSS dissertation support if you need help with data cleaning, SPSS analysis, output interpretation, APA tables, or dissertation results writing.
What Is Jamovi?
Jamovi is a free and open statistical software program designed to make data analysis easier for students, researchers, and instructors. The official Jamovi documentation describes it as free and open statistical software created to bridge the gap between researchers and statisticians.
Jamovi has a spreadsheet-style interface, which makes it familiar to students who have used Excel or other data-entry tools. Instead of requiring users to write code for every analysis, Jamovi allows users to select statistical procedures from menus, assign variables, and view results in a clean output panel. This makes it attractive for students who are learning statistics for the first time.
One major reason students compare Jamovi and SPSS is cost. Jamovi is free and open-source, while SPSS usually requires a paid license or institutional access. Jamovi’s official website describes it as a “3rd generation” statistical spreadsheet and a compelling alternative to costly statistical products such as SPSS and SAS.
Jamovi is also connected to R. Its official site explains that Jamovi is built on top of the R statistical language, and its documentation explains that users can work with R through the Rj Editor module, the jmv R package, and syntax mode. This matters because students can begin with a simple menu-based interface and later explore R-based workflows if their research becomes more advanced.
Jamovi can be useful for descriptive statistics, frequencies, t-tests, ANOVA, correlation, regression, chi-square tests, nonparametric tests, and reliability analysis. It is especially helpful for assignments, early research projects, statistical learning, and dissertation projects where the supervisor accepts Jamovi output.
However, students should not assume Jamovi is automatically accepted for every dissertation. Some supervisors, departments, and institutions may expect SPSS, R, Stata, SAS, or another approved statistical package. Before using Jamovi for final dissertation analysis, ask your supervisor whether Jamovi output is acceptable.
What Is SPSS?
SPSS, officially IBM SPSS Statistics, is a long-established statistical software package used for academic research, dissertation analysis, institutional research, social science research, healthcare research, psychology, education, business, and survey data analysis.
IBM describes SPSS Statistics as a platform that offers statistical testing, regression, forecasting, and extensible modeling. IBM also describes SPSS as a tool for advanced data analysis, predictive modeling, forecasting, and AI-assisted insights.
SPSS remains popular in dissertation research because many supervisors, examiners, and academic departments are familiar with its output. Students often use SPSS for questionnaire data, Likert-scale responses, experimental data, survey datasets, demographic comparisons, group differences, prediction models, and reliability analysis.
SPSS includes two important setup areas: Data View and Variable View. Data View contains the actual dataset, while Variable View allows users to define variable names, labels, values, missing values, measurement levels, and other properties. This structure is useful for dissertation datasets because many student projects involve coded survey responses, categorical variables, demographic groups, scale scores, and missing data.
SPSS also supports syntax. IBM provides command syntax documentation for SPSS Statistics, which allows users to document, reproduce, and rerun analyses through command-based workflows. This can be important in dissertation work because supervisors may ask how the analysis was conducted or whether the output can be reproduced.
SPSS is often the safer option when a student needs formal dissertation output, supervisor-recognized tables, advanced procedures, or professional SPSS support. If your university expects SPSS output, using Jamovi instead may create unnecessary problems even if Jamovi can technically run the same test.
Students who need help with SPSS output, assumption testing, or results interpretation can request SPSS data analysis help before submitting their findings.
Jamovi vs SPSS: Quick Comparison Table
| Feature | Jamovi | SPSS |
|---|---|---|
| Cost | Free and open-source | Paid/licensed software |
| Ease of use | Very beginner-friendly | Beginner-friendly but more detailed |
| Interface | Modern spreadsheet-style interface | Traditional Data View and Variable View |
| Output style | Clean and easy to read | Detailed SPSS output viewer |
| Learning curve | Lower for basic analyses | Moderate when using full features |
| Common tests | Supports many common student analyses | Supports common and advanced analyses |
| Advanced analysis | Available through modules and R integration | Stronger built-in advanced procedures |
| Syntax | R-based options and syntax mode | SPSS syntax |
| APA reporting | Often cleaner for basic reporting | Usually requires more formatting |
| Supervisor familiarity | Growing | Very high in many institutions |
| Dissertation use | Depends on institutional acceptance | Widely accepted in dissertation settings |
| Best for | Learning, low-cost projects, common tests | Formal dissertation analysis and supervisor-reviewed output |
Jamovi may be better when cost, simplicity, and clean output matter most. SPSS may be better when supervisor familiarity, advanced analysis, detailed variable setup, and formal dissertation expectations matter most.
Neither tool is automatically better for every student. The right choice depends on your research design, data type, analysis plan, and supervisor expectations.
Is Jamovi the Same as SPSS?
No, Jamovi and SPSS are not the same software.
They overlap because both can run many statistical tests used in student research. A student may use either Jamovi or SPSS for descriptive statistics, frequencies, crosstabs, chi-square tests, t-tests, ANOVA, correlation, regression, reliability analysis, and some nonparametric tests.
The difference is in the software design, cost, output style, institutional recognition, syntax system, advanced analysis options, and supervisor familiarity. Jamovi is free, open-source, and built on R. SPSS is commercial software developed by IBM and widely used in formal academic and applied research settings.
For students, the biggest issue is not always whether Jamovi or SPSS can run the test. The bigger issue is whether the student selected the correct test, coded the data properly, checked assumptions, interpreted the output correctly, and reported the results in dissertation-ready language.
A student can run the wrong test in either Jamovi or SPSS. A student can also misinterpret correct output in either tool. Software helps with computation, but it does not replace statistical judgment.
When Should You Use Jamovi?
Jamovi may be a good choice when you need a free, simple, and beginner-friendly statistical tool. It is especially helpful for students who are still learning how statistical tests work and want a visual, menu-based way to explore their data.
You may choose Jamovi when your project involves basic or moderate statistical analysis. For example, Jamovi may work well for a class assignment comparing two groups with a t-test, a small research project using correlation, or an introductory dissertation draft where the supervisor accepts Jamovi output.
Jamovi can also be useful when you want clean tables and a less intimidating interface. Students who find SPSS overwhelming may find Jamovi easier because the layout is more modern and the results appear in a clear output area. This can help learners understand the connection between variables, analysis settings, and statistical results.
| Situation | Why Jamovi May Work |
|---|---|
| You have no software budget | Jamovi is free and open-source |
| You are learning statistics | The interface is simple and beginner-friendly |
| You need common tests | Jamovi supports many basic and moderate analyses |
| You want clean output | Results are usually easy to read |
| You want R integration | Jamovi connects with R-based tools |
| Your supervisor accepts Jamovi | Institutional acceptance reduces risk |
| You are doing early data exploration | Jamovi is useful for checking patterns before final analysis |
However, Jamovi may not be ideal if your supervisor specifically asks for SPSS output, if your dissertation rubric mentions SPSS, or if your analysis requires advanced procedures that are easier to complete in SPSS, R, Stata, or SAS.
Before using Jamovi for final dissertation submission, confirm acceptance with your instructor, supervisor, or committee.
When Should You Use SPSS?
SPSS may be the better choice when your project requires formal dissertation-level analysis, detailed variable coding, supervisor-recognized output, or advanced procedures.
Many dissertation students use SPSS because it is familiar to supervisors and committees. This is especially important when the student must submit output, explain analysis decisions, revise results after feedback, or defend statistical choices during a proposal defense or final defense.
SPSS is also useful when working with survey datasets. Survey-based dissertations often include demographic variables, Likert-scale items, composite scores, coded responses, missing values, and grouped comparisons. SPSS makes it possible to define variable labels, value labels, missing value codes, and measurement levels in a structured way.
| Situation | Why SPSS May Be Better |
|---|---|
| Your supervisor expects SPSS | It avoids unnecessary software approval issues |
| You are writing a dissertation | SPSS output is widely recognized |
| You have survey data | SPSS handles coding and labels well |
| You need advanced procedures | SPSS has strong built-in options |
| You need syntax documentation | SPSS syntax supports reproducibility |
| Your committee is familiar with SPSS | Output review becomes easier |
| You need professional SPSS help | Many dissertation statisticians work with SPSS |
SPSS may take longer to learn than Jamovi because students must understand Data View, Variable View, value labels, missing values, measurement levels, output tables, and syntax options. However, once the dataset is properly prepared, SPSS becomes powerful for dissertation analysis.
Students working on formal dissertations can request dissertation data analysis help when they need support with SPSS test selection, output interpretation, APA reporting, and Chapter 4 writing.
Jamovi or SPSS for Dissertation Data Analysis?
The best tool for dissertation data analysis depends on your research design, not only your personal preference. A dissertation analysis must connect research questions, hypotheses, variables, measurement levels, statistical tests, assumptions, output, and interpretation.
Jamovi can be suitable for dissertations when the analysis is basic to moderate and the supervisor accepts the software. For example, a student conducting a simple survey with descriptive statistics, t-tests, correlation, or one-way ANOVA may be able to use Jamovi if the department allows it.
SPSS is often safer for formal dissertations because it is widely recognized, especially in social sciences, psychology, education, healthcare, nursing, and business research. It is also stronger when the dataset needs detailed coding, labels, missing value definitions, scale construction, regression modeling, reliability testing, or supervisor-reviewed output.
| Dissertation Requirement | Better Fit |
|---|---|
| Supervisor specifically asks for SPSS | SPSS |
| No software budget | Jamovi |
| Basic class assignment | Jamovi or SPSS |
| Formal master’s dissertation | Usually SPSS, unless Jamovi is accepted |
| Formal PhD dissertation | Usually SPSS, R, Stata, SAS, or another approved tool |
| Complex survey dataset | SPSS |
| Learning statistics visually | Jamovi |
| Quick APA-style output | Jamovi |
| Traditional dissertation output | SPSS |
| Advanced modeling | Often SPSS, R, Stata, or SAS |
| Results chapter writing | Depends on analyst expertise, not only software |
The safest approach is to check your proposal, methodology chapter, supervisor instructions, and university guidelines before choosing software. If your methodology chapter says you will use SPSS, then your final analysis should normally be completed in SPSS unless your supervisor approves a change.
If you are unsure whether Jamovi or SPSS is suitable for your dissertation, our team can review your proposal, research questions, hypotheses, and dataset before recommending the best analysis route. You can also request quantitative research analysis help if your project has reached the data analysis stage.
Common Statistical Tests You Can Run in Both Jamovi and SPSS
Jamovi and SPSS both support many statistical procedures used in dissertations and academic research. The software can perform the calculations, but the student still needs to select the correct test and explain the results properly.
Descriptive Statistics
Descriptive statistics summarize the main features of a dataset. Students use them to describe demographic variables, survey responses, scale scores, baseline characteristics, and outcome variables.
Common descriptive statistics include means, medians, standard deviations, frequencies, percentages, minimums, maximums, skewness, and kurtosis. For example, a dissertation student may use frequencies and percentages to describe gender, age category, education level, employment status, or academic program. The same student may use means and standard deviations to summarize age, satisfaction scores, knowledge scores, or attitude scale scores.
Descriptive statistics are usually presented before inferential tests because they help the reader understand the sample. However, they do not usually answer hypothesis-testing questions by themselves. They prepare the reader for the deeper statistical analysis that follows.
T-Tests
T-tests compare means. They are common in student research because many projects involve comparing one group, two separate groups, or the same group measured at two time points.
A one-sample t-test compares one sample mean with a known or expected value. An independent samples t-test compares two separate groups. A paired samples t-test compares two related measurements, such as pre-test and post-test scores.
Students often make the mistake of reporting only the p-value. A stronger t-test interpretation should also consider the group means, mean difference, confidence interval, effect size, direction of the result, and practical meaning of the finding.
ANOVA
ANOVA is used when a student wants to compare means across three or more groups. One-way ANOVA is common when there is one independent grouping variable. Repeated measures ANOVA is used when the same participants are measured more than twice. Factorial ANOVA is used when there is more than one independent variable.
Students often need help with ANOVA because a significant ANOVA result does not automatically explain which groups differ. Post hoc tests or planned comparisons may be needed to identify where the differences occur.
For example, if a student compares academic stress across three degree levels and finds a significant ANOVA result, the next step may involve post hoc tests to determine which degree levels differ from each other.
Chi-Square Test
The chi-square test of independence examines whether two categorical variables are associated. It is commonly used in survey research, education studies, healthcare studies, business research, psychology, and social science projects.
For example, a student may use chi-square to test whether employment status is associated with program type. The result is usually based on a contingency table showing observed and expected frequencies.
Students must check whether expected cell counts are adequate. If too many expected counts are low, the chi-square result may not be reliable, and another approach may be needed.
Correlation
Correlation measures the direction and strength of a relationship between two variables. Pearson correlation is commonly used for continuous variables that meet relevant assumptions. Spearman correlation is often used for ordinal variables or non-normal relationships.
A positive correlation means that as one variable increases, the other tends to increase. A negative correlation means that as one variable increases, the other tends to decrease.
Students must avoid saying that correlation proves causation. A significant correlation shows association, not cause and effect. A strong dissertation interpretation should explain the direction, strength, significance, and practical meaning of the relationship.
Regression Analysis
Regression analysis is one of the most important methods in dissertation statistics because it helps examine prediction and relationships between variables.
Linear regression is used when the dependent variable is continuous. Logistic regression is used when the dependent variable is categorical, often binary. Multiple regression allows students to examine several predictors at the same time.
Regression creates difficulty because students must interpret more than one statistic. A strong regression interpretation may include model fit, R-squared, adjusted R-squared, F-test, coefficients, standard errors, confidence intervals, p-values, multicollinearity diagnostics, residual patterns, and practical meaning.
If regression is central to your dissertation, you may need regression analysis help to make sure your model is appropriate, defensible, and correctly reported.
Reliability Analysis
Reliability analysis is common in questionnaire-based dissertations. Students often use Cronbach’s alpha to assess whether several items measure the same construct consistently.
For example, a survey may include several items measuring academic motivation, job satisfaction, stress, patient safety culture, or leadership perception. Reliability analysis helps determine whether those items can be combined into a scale.
Students should not interpret Cronbach’s alpha mechanically. They should consider the number of items, item-total correlations, construct theory, and whether deleting an item improves or weakens the scale.
Key Differences in Output and Reporting
Jamovi and SPSS differ in how they present results. Jamovi output is often cleaner and easier for beginners to read. Many students like that the output appears beside the data and updates as analysis settings change.
SPSS output is more traditional and detailed. It may include multiple tables, model summaries, assumption-related outputs, test statistics, charts, and optional syntax-based documentation. This detail can be useful for dissertation work, but it can also overwhelm students who do not know which tables matter.
Jamovi may be better for quick APA-style presentation of basic results. SPSS may require more formatting, but it is familiar to many supervisors and dissertation committees.
The most important point is that raw output should not be copied directly into a dissertation. A strong results chapter should explain what test was used, why it was appropriate, whether assumptions were checked, what the result showed, whether the hypothesis was supported, and what the finding means in relation to the research question.
Students who already have SPSS output but do not know how to explain it can request results chapter support for interpretation, APA tables, and dissertation-ready results writing.
Which Is Easier to Learn: Jamovi or SPSS?
Jamovi is usually easier for complete beginners. Its interface is simple, modern, and less intimidating. Students can often run basic descriptive statistics, t-tests, ANOVA, correlation, and regression after a short learning period.
SPSS is also beginner-friendly, but it has more layers. Students must understand Data View, Variable View, variable labels, value labels, missing values, measurement levels, output tables, charts, and syntax. These features are powerful, but they can feel confusing at first.
The bigger challenge is not usually clicking the right menu. The bigger challenge is knowing which test fits the research question.
For example, a student may know how to run both correlation and regression but may not know which one fits the hypothesis. Another student may run ANOVA without checking assumptions or without using post hoc comparisons. A third student may run regression without checking multicollinearity.
Jamovi may be easier to learn, but SPSS may be more useful when a dissertation committee expects SPSS output.
Which Is Better for APA Reporting?
Jamovi often produces cleaner output for basic APA-style reporting. This can help students who need readable tables for assignments, early drafts, and simple statistical analyses.
SPSS output is detailed but usually needs more formatting before it fits APA style. Students should not paste every SPSS table into a dissertation. Instead, they should extract the relevant statistics and present them in well-organized APA-style tables and paragraphs.
| Reporting Element | Why It Matters |
|---|---|
| Correct test name | Shows the analysis matches the research question |
| Test statistic | Provides the main statistical result |
| Degrees of freedom | Supports accurate reporting |
| p-value | Shows statistical significance |
| Confidence interval | Shows estimate precision |
| Effect size | Shows practical importance |
| Direction of result | Explains what changed or differed |
| Interpretation | Connects the result to the research question |
A weak reporting sentence says, “The result was significant.” A stronger reporting sentence explains which test was used, what groups or variables were analyzed, whether the result was significant, and what the finding means for the study.
Correct APA reporting depends on statistical understanding, not just software output.
Common Problems Students Face With Jamovi and SPSS
Students often believe their main problem is choosing between Jamovi and SPSS. In reality, the bigger problem is usually the analysis process.
A student can use good software and still produce weak results if the variables are coded incorrectly, the wrong test is selected, assumptions are ignored, or the output is misinterpreted.
| Problem | Why It Matters |
|---|---|
| Choosing the wrong statistical test | The result may not answer the research question |
| Coding variables incorrectly | The output may become misleading |
| Mislabeling categorical variables | Group comparisons may be invalid |
| Ignoring missing data | Results may become biased |
| Skipping assumption checks | Inferential tests may not be appropriate |
| Treating ordinal data as interval without justification | The analysis may be challenged |
| Misinterpreting p-values | Statistical significance may be overstated |
| Ignoring effect sizes | Practical meaning may be unclear |
| Confusing correlation with causation | The discussion may make unsupported claims |
| Running regression without diagnostics | The model may violate key assumptions |
| Pasting raw output into Chapter 4 | The results section may look unprofessional |
| Failing to align tests with hypotheses | The methodology may appear weak |
These problems can lead to supervisor comments, revision requests, delayed submission, or weak dissertation results chapters. The solution is not only to choose better software. The solution is to follow a defensible statistical process from data preparation to final reporting.
Do You Need Help With Jamovi or SPSS Data Analysis?
You may need professional help if you are unsure which software to use, which statistical test fits your research questions, or how to interpret your output. Jamovi and SPSS can both produce statistical results, but neither tool can guarantee that your analysis is methodologically correct.
At SPSSDissertationHelp.com, students can request support with choosing between Jamovi and SPSS, reviewing research questions, selecting statistical tests, cleaning and coding data, preparing variable labels, running SPSS analysis, interpreting output, formatting APA tables, and writing dissertation results chapters.
This support is especially useful when you have collected your data but do not know how to move from raw numbers to a clear, defensible Chapter 4. It is also helpful when your supervisor has requested revisions and you need to correct your analysis or rewrite your results section.
You can request help with:
- Choosing the right statistical software
- Reviewing research questions and hypotheses
- Selecting the correct test
- Cleaning and coding your dataset
- Running SPSS data analysis
- Interpreting Jamovi or SPSS output
- Checking assumptions
- Formatting APA tables
- Writing Chapter 4 results
- Revising analysis after supervisor feedback
Request SPSS Data Analysis Help
Jamovi SPSS Comparison: Which One Should You Choose?
Choose Jamovi if you need a free tool, are learning statistics, have a basic or moderate analysis, prefer clean output, and your supervisor accepts Jamovi. It is a strong option for students who want an accessible way to learn statistical analysis without paying for licensed software.
Choose SPSS if your university expects SPSS, your supervisor is familiar with SPSS output, your dissertation uses a complex dataset, or your analysis requires advanced procedures. SPSS is also a strong option when you need professional support, syntax documentation, traditional dissertation output, and APA-ready results interpretation.
| Choose Jamovi If… | Choose SPSS If… |
|---|---|
| You need free software | Your supervisor expects SPSS |
| You are learning statistics | Your dissertation requires formal output |
| Your analysis is basic to moderate | Your dataset is complex |
| Your supervisor accepts Jamovi | Your committee knows SPSS |
| You prefer a simple interface | You need detailed variable setup |
| You want clean output | You need syntax documentation |
| You are exploring data | You need professional SPSS support |
For most formal dissertation projects, SPSS is often the safer choice when supervisor familiarity and institutional expectations matter. Jamovi is a strong choice when affordability, accessibility, and simplicity matter more.
The best software is the one that fits your research design, supervisor expectations, analysis plan, and reporting requirements.
FAQs About Jamovi SPSS
Jamovi is better for students who need a free, beginner-friendly tool for common statistical analyses. SPSS is often better for formal dissertation projects, supervisor-reviewed output, institutional expectations, and advanced procedures.
Jamovi can replace SPSS for many basic and moderate analyses, including descriptive statistics, t-tests, ANOVA, correlation, regression, chi-square tests, and reliability analysis. However, SPSS may still be preferred when your university, supervisor, or analysis plan requires it.
Some institutions may accept Jamovi for dissertations, but students should confirm with their supervisor, department, or dissertation committee before using it for final analysis.
SPSS is manageable for beginners, but students often struggle with variable coding, value labels, missing data, measurement levels, assumption testing, output interpretation, and APA reporting.
Yes. Jamovi can run common regression analyses. Because Jamovi is connected to R, additional options may also be available through modules and R-based workflows.
SPSS can run most common tests students perform in Jamovi and includes many additional procedures used in academic and applied research. IBM describes SPSS Statistics as offering statistical testing, regression, forecasting, and extensible modeling.
Jamovi often gives cleaner output for basic APA-style reporting, while SPSS output usually needs more formatting. However, correct APA reporting depends on the analyst’s understanding of the test, not only the software output.
You may need a statistician if you are unsure about test selection, assumptions, missing data, regression diagnostics, output interpretation, APA formatting, or results chapter writing. Software can run the test, but it cannot guarantee that the test is correct for your research design.
Use the software approved by your supervisor or committee. SPSS is often safer when traditional dissertation output is expected. Jamovi may be acceptable if your institution allows it and your analysis is suitable for the software.
Yes. Some students use Jamovi to learn statistics or explore data, then use SPSS for final dissertation output. However, final analysis should be consistent, documented, and approved by your supervisor.
Conclusion
Jamovi and SPSS are both useful statistical tools, but they serve different student needs. Jamovi is strong for affordability, beginner learning, clean output, and common statistical tests. SPSS is strong for dissertation analysis, supervisor familiarity, detailed variable setup, advanced procedures, syntax documentation, and widely recognized output.
For students comparing jamovi SPSS, the right question is not simply, “Which software is easier?” The better question is, “Which software fits my research questions, dataset, supervisor expectations, analysis plan, and reporting requirements?”
If you are working on a dissertation, thesis, research paper, or journal manuscript and you are unsure whether to use Jamovi or SPSS, contact spssdissertationhelp.com for professional statistical analysis support.