
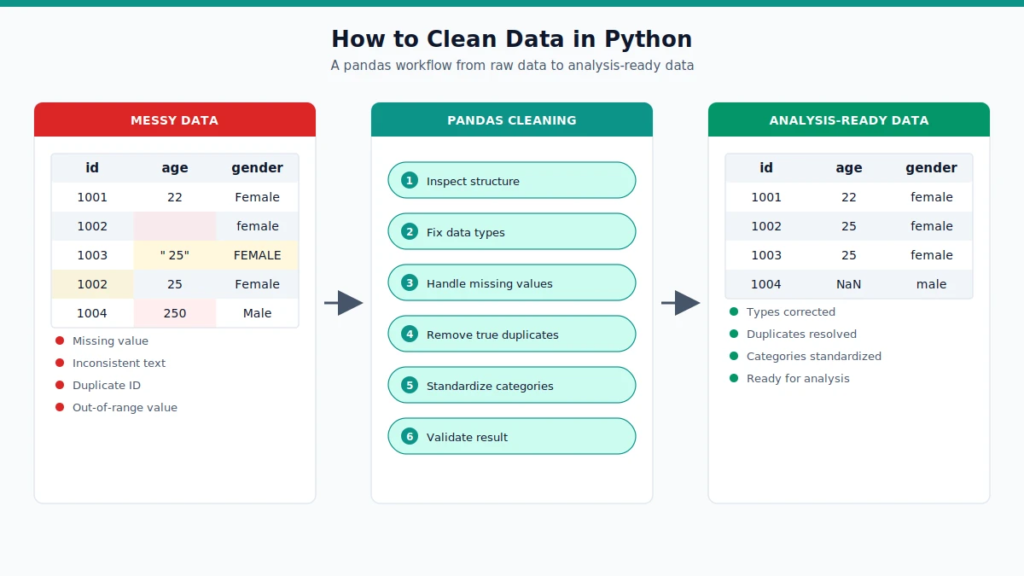
Cleaning data in Python means taking a raw, messy dataset and turning it into something you can trust for analysis. In practice, that involves inspecting the data, fixing column names and data types, identifying missing and duplicate records, standardizing inconsistent values, investigating anything that looks invalid or extreme, and validating the result before saving a clean copy. The library that does most of this work is pandas, Python’s core data-handling package.
This tutorial walks through that process on one realistic, survey-style dataset, the kind many dissertation and thesis researchers actually work with, so you finish with a script you can adapt to your own data, not just a list of isolated commands.
Quick Answer: How to Clean Data in Python
- Load the dataset with pandas.
- Inspect rows, columns, data types, and missing values.
- Standardize column names.
- Correct incorrect data types.
- Handle missing observations appropriately.
- Identify and resolve duplicates.
- Standardize text and categorical values.
- Check for impossible or invalid values.
- Investigate potential outliers.
- Validate the cleaned dataset.
- Export a new, clean file, and keep the raw one untouched.
Each of these steps is explained in detail below, with working code you can run in Jupyter, Colab, or VS Code.
What Is Data Cleaning in Python?
Data cleaning is the process of finding and correcting problems in a dataset (incorrect types, missing values, duplicate records, inconsistent labels, and implausible entries) before that dataset is used for statistics, visualization, or modeling. “Raw data” is whatever came out of your collection tool: a Qualtrics export, a lab instrument log, an Excel workbook someone hand-edited. “Clean data” is a version of that same dataset where the values are the correct type, missingness is explicit and understood, and categories mean what they say they mean.
Pandas fits into this process as the primary tool for inspecting and transforming tabular data in Python. It loads spreadsheets and CSVs into a DataFrame, a table-like object, and gives you vectorized methods to check, filter, and reshape that table without writing manual loops.
Cleaning has to happen before analysis for a simple reason: statistical functions and machine-learning estimators assume the data means what it appears to mean. If age is stored as text, pandas and NumPy can’t compute a mean on it. If a Likert item allows values 1 to 5 but the file also contains a stray 8, a mean score for that item is no longer meaningful. And cleaning has to be reproducible for a dissertation, a co-author, or your future self, because “I fixed it in Excel by hand” is not something you can defend to a supervisor or an examiner.
Research example: a psychology dissertation collects 240 survey responses through Qualtrics. The export contains a duplicate submission from one participant, a handful of blank Likert items, an age column that imported as text because one row read “twenty-five,” and a gender field with five different spellings of “female.” None of this is unusual, it’s what real survey exports look like, and none of it can be fixed by simply opening the file and skimming it.
Why Should You Clean Data Before Analysis?
Skipping this step doesn’t just risk a Python error. It risks:
- Biased statistics: a mean or proportion calculated on a dataset with unresolved miscoding no longer describes your actual sample.
- Incorrect sample size: undetected duplicates inflate n; undetected missingness can silently shrink it inconsistently across variables.
- Failed functions:
pandasandscikit-learnmethods will raise errors, or worse, silently coerce text toNaN, when a column’s type doesn’t match what the function expects. - Misleading visualizations: a single data-entry error (age = 250) can distort an axis scale enough to hide the real pattern in a chart.
- Distorted correlations and regression coefficients: outliers and coding errors pull least-squares estimates in ways that are easy to miss until you check.
- Unreliable ANOVA or t-test results: group differences can appear or disappear depending on whether duplicate cases and invalid codes are still in the data.
- Weaker machine-learning performance: models trained on inconsistent categories or unhandled missing values learn noise instead of signal.
- Incorrect research conclusions: the most consequential outcome, and the reason a methods section needs to describe how the data was cleaned, not just what test was run.
None of this means clean data guarantees correct results. A well-cleaned dataset can still be analyzed with the wrong test or interpreted incorrectly. Cleaning removes one source of error; it doesn’t remove the need for sound methodology.
Python Libraries Used for Data Cleaning
| Library | Main role | Common cleaning use |
|---|---|---|
| pandas | Tabular data handling | Loading files, inspecting structure, fixing types, handling missing values, deduplication, string cleaning |
| NumPy | Numerical computing | Underlying array operations, NaN handling, numeric comparisons used inside pandas |
| SciPy (optional) | Statistical functions | z-score calculations for outlier detection |
| scikit-learn (optional) | Machine learning preprocessing | Imputers and scalers when preparing data specifically for modeling pipelines |
Pandas does almost all of the work in this tutorial. NumPy appears mainly through pandas’ own internals (for example, np.nan). SciPy and scikit-learn are mentioned only where they add something pandas alone doesn’t; they are not the focus of this article.
A Reproducible Example Dataset
Every step below uses one dataset: a mock survey of students reporting study habits and satisfaction. It has the problems real survey exports have.
Messy data (excerpt):
| participant_id | age | gender | study_hours | satisfaction_score | survey_date | program | final_score |
|---|---|---|---|---|---|---|---|
| 1001 | 22 | Female | 15 | 4 | 2024-03-01 | Business | 78 |
| 1002 | ” 25″ | female | 8 | 03/02/2024 | business admin | 85 | |
| 1003 | FEMALE | 20 | 5 | 2024-03-02 | Business | 130 | |
| 1004 | 19 | Male | 12 | 3 | 2024/03/03 | Psych | 91 |
| 1002 | 25 | Female | 8 | 4 | 2024-03-02 | Business Admin | 85 |
Notice the missing age, the duplicate participant 1002, three spellings of “female,” a stray leading space, an out-of-range final_score of 130, and three different date formats in one column. This is a realistic, not exaggerated, level of mess.
Create it in Python so you can follow along:
import pandas as pd
import numpy as np

data = {
    "participant_id": [1001, 1002, 1003, 1004, 1002],
    " Age ": ["22", " 25", np.nan, "19", "25"],
    "Gender": ["Female", "female", "FEMALE", "Male", "Female"],
    "Study_Hours": [15, 8, 20, 12, 8],
    "Satisfaction_Score": [4, np.nan, 5, 3, 4],
    "Survey_Date": ["2024-03-01", "03/02/2024", "2024-03-02", "2024/03/03", "2024-03-02"],
    "Program": ["Business", "business admin", "Business", "Psych", "Business Admin"],
    "Final_Score": [78, 85, 130, 91, 85],
}

df = pd.DataFrame(data)
Step 1: Import Pandas and Load the Dataset
import pandas as pd

# From a CSV export (Qualtrics, Google Forms, etc.)
df = pd.read_csv("survey_data_raw.csv")

# From an Excel workbook
df = pd.read_excel("survey_data_raw.xlsx")
Once loaded, get an overview before changing anything:
df.head()      # first 5 rows, spot obvious formatting issues
df.shape       # (rows, columns), confirms the file loaded completely
df.columns     # exact column names, including stray spaces or capitalization
df.info()      # data type and non-null count for every column
df.info() in particular tells you which columns pandas thinks are numeric, text, or datetime, and whether a column you expect to be numeric actually loaded as an object (text), which is one of the most common signs of a hidden formatting problem.
Step 2: Preserve the Raw Dataset
Before transforming anything, keep an untouched copy. This is not optional for research data: it is what lets you retrace every decision later, whether for a methods section, a supervisor’s question, or a mistake you catch three steps from now.
raw_df = df.copy()     # never modify this
clean_df = df.copy()   # all cleaning happens on this copy
All subsequent steps operate on clean_df. If a supervisor asks how many cases were excluded and why, raw_df is still there to compare against, which is the basis of a defensible audit trail, not just good practice.
Step 3: Inspect the Dataset Before Changing Anything
| Check | Python command | What it detects |
|---|---|---|
| Shape | clean_df.shape | Whether all expected rows/columns loaded |
| Data types | clean_df.info() | Columns stored as the wrong type |
| Missing values | clean_df.isna().sum() | Count of missing values per column |
| Duplicates | clean_df.duplicated().sum() | Fully duplicated rows |
| Category values | clean_df["Gender"].unique() | Inconsistent spellings or capitalization |
| Summary statistics | clean_df.describe(include="all") | Impossible values, unexpected ranges |
clean_df.describe(include="all")   # numeric AND categorical summary
clean_df["Gender"].unique()        # reveals "Female", "female", "FEMALE"
Step 4: Clean and Standardize Column Names
Inconsistent column names (mixed case, stray spaces) make every later line of code more error-prone.
clean_df.columns = (
    clean_df.columns
    .str.strip()
    .str.lower()
    .str.replace(" ", "_")
)
# " Age " -> "age", "Survey_Date" -> "survey_date"
Result: participant_id, age, gender, study_hours, satisfaction_score, survey_date, program, final_score, all predictable, script-friendly names.
Step 5: Correct Data Types
clean_df["age"] = pd.to_numeric(clean_df["age"], errors="coerce")
clean_df["survey_date"] = pd.to_datetime(clean_df["survey_date"], errors="coerce")
errors="coerce" tells pandas to convert anything it can’t parse into NaN (or NaT for dates) instead of raising an error. This is convenient, but it is also how silent data loss happens, so always check what got coerced:
clean_df[clean_df["age"].isna()] # inspect rows where conversion failed
| Column | Before | After | Note |
|---|---|---|---|
| age | " 25" (text) | 25 (numeric) | Whitespace handled automatically by to_numeric |
| age | NaN (text) | NaN (numeric) | Genuinely missing; coercion didn’t create this one |
| survey_date | "03/02/2024" | 2024-03-02 | Format inferred; verify manually for ambiguous dates |
Step 6: Find Missing Values in Python
clean_df.isna().sum()          # count of missing values per column
clean_df.isna().mean() * 100   # percentage missing per column
Pandas recognizes NaN and None as missing automatically. It does not automatically recognize blank strings ("") or coded missing values such as 999, 99, -9, or "N/A", which look like valid data until you tell pandas otherwise:
clean_df = clean_df.replace([999, -9, "N/A", ""], pd.NA)
Only apply this if your codebook or data-collection instrument actually defines those values as missing. Recoding a legitimate value of 99 (say, a real age or real score) as missing because it happens to match a placeholder from a different variable is a correction you cannot undo without the raw file.
Step 7: Handle Missing Data Correctly
This is the step most tutorials oversimplify. There is no single correct way to handle missing values. The right approach depends on how much is missing, why it’s missing, and what analysis you’re preparing for.
Three broad missingness patterns are worth knowing, without turning this into a full methodology detour:
- MCAR (missing completely at random): missingness unrelated to any value, observed or not.
- MAR (missing at random): missingness related to other observed variables, but not the missing value itself.
- MNAR (missing not at random): missingness related to the value that’s missing (e.g., higher earners skipping an income question).
The pattern affects whether deletion or imputation is defensible. A supervisor or examiner may ask which pattern you assumed and why.
Common approaches:
- Keep it missing: appropriate when the variable won’t be used in the current analysis, or when imputation would misrepresent genuine non-response.
- Complete-case deletion (
dropna()): simplest, but reduces sample size and can bias results if missingness isn’t MCAR. - Dropping a column: reasonable only when a variable is missing so extensively it can’t support any analysis.
- Mean / median / mode imputation: replaces missing values with a central tendency; can artificially shrink variance and should be used cautiously, not by default.
- Group-based imputation: imputes within a meaningful subgroup (e.g., by program) rather than the whole sample, which is often more defensible than a single overall mean.
- Advanced imputation (multiple imputation, model-based methods): appropriate for larger-scale or publication-track research, typically beyond the scope of a single cleaning script.
clean_df.dropna(subset=["participant_id"])                 # drop rows missing a key ID
clean_df["satisfaction_score"].fillna(
    clean_df.groupby("program")["satisfaction_score"].transform("mean")
)  # group-based mean imputation, not a blanket overall mean
Do not replace every missing numeric value with the overall mean by default. It is fast, but it is a methodological decision, not a technical default, and it needs to be stated and justified in your methods section if you use it.
dropna() vs. fillna()
dropna() | fillna() | |
|---|---|---|
| Effect | Removes rows or columns | Replaces missing values with a specified value |
| Best for | Small amounts of missingness, key identifier fields | Variables where a defensible replacement value exists |
| Risk | Reduces sample size, can bias results if not MCAR | Can distort variance or misrepresent non-response if applied carelessly |
| Research note | Report how many cases were dropped and why | Report the imputation method used, not just that imputation occurred |
Step 8: Detect and Remove Duplicate Rows
clean_df.duplicated().sum()        # fully duplicated rows
clean_df.drop_duplicates()         # removes exact duplicates
A duplicate row is not the same thing as a duplicate participant. Check by ID specifically:
clean_df.duplicated(subset=["participant_id"]).sum()
clean_df[clean_df.duplicated(subset=["participant_id"], keep=False)]
Repeated participant IDs are not automatically an error. They occur legitimately in:
- longitudinal studies (same participant, multiple time points)
- repeated-measures designs
- multi-visit clinical or educational data
- panel datasets
Before dropping anything on the basis of a repeated ID, confirm whether your study design expects repeats. Dropping a legitimate repeated measurement because it looked like a duplicate is a common and consequential mistake.
Step 9: Standardize Text and Categorical Values
clean_df["gender"] = clean_df["gender"].str.strip().str.lower()
# "Female", "female", "FEMALE", " Female" -> "female"

clean_df["program"] = clean_df["program"].replace({
    "business admin": "business",
    "Business Admin": "business",
    "Business": "business",
})
Standardization decisions should follow your codebook, not arbitrary assumptions. If your instrument defines gender categories as “Male,” “Female,” “Non-binary,” and “Prefer not to say,” standardize to those exact categories; don’t silently merge categories the instrument treats as distinct.
How to Clean String Data in pandas
clean_df["program"] = (
    clean_df["program"]
    .str.strip()                          # remove leading/trailing spaces
    .str.lower()                          # standardize capitalization
    .str.replace(r"\s+", " ", regex=True)  # collapse repeated spaces
)
Heavier regex cleanup is rarely necessary for survey-style categorical data. Reach for it only when values genuinely require pattern matching (e.g., extracting a numeric code embedded in free text).
Step 10: Identify Invalid and Impossible Values
| Variable | Valid rule | Example invalid value |
|---|---|---|
| age | 18 to 100 (adult sample) | -5, 250 |
| Likert item (1 to 5 scale) | 1 to 5 | 8 |
| percentage | 0 to 100 | 130 |
| survey_date | On or before study close date | date after closing |
invalid_age = ~clean_df["age"].between(18, 100)
clean_df[invalid_age]   # inspect, don't auto-delete
An out-of-range value should be investigated, not automatically removed. It might be a data-entry error (fixable), a genuine outlier (retain, with a note), or a sign the variable was miscoded upstream (needs a rule change, not a row deletion).
Step 11: Find Outliers in Python
Three different things get called “outliers,” and they need different responses:
- Data-entry errors: a Likert response of 8 on a 1 to 5 scale. Correct or exclude, not retain as-is.
- Extreme but valid observations: a genuinely very high study-hours value from one dedicated student. Usually retain.
- Statistical outliers: values far from the rest of the distribution that may or may not be errors, and need investigation either way.
IQR method:
q1 = clean_df["final_score"].quantile(0.25)
q3 = clean_df["final_score"].quantile(0.75)
iqr = q3 - q1

lower_bound = q1 - 1.5 * iqr
upper_bound = q3 + 1.5 * iqr

outliers = clean_df[(clean_df["final_score"] < lower_bound) | (clean_df["final_score"] > upper_bound)]
Z-score method:
from scipy import stats

z_scores = stats.zscore(clean_df["final_score"].dropna())
outlier_mask = abs(z_scores) > 3
Neither method tells you what to do with a flagged value. Depending on context, options include: verify against the original source, correct a known entry error, retain it as a legitimate value, transform the variable (e.g., log transform), winsorize, or remove it, with the reason documented. Automatically deleting everything outside 1.5×IQR is not a defensible default; it’s a decision that needs a stated rationale, the same way it would in SPSS or Stata.
Step 12: Check Categorical Values
clean_df["gender"].value_counts()
clean_df["program"].unique()
clean_df["program"].nunique()
value_counts() will surface exactly the kind of inconsistency (“male,” “Male,” “M”) that silently splits one real category into three during analysis. This check is worth running on every categorical column before moving on.
Step 13: Rename or Recode Values
clean_df["gender_binary"] = clean_df["gender"].replace({"male": 0, "female": 1})

# or, for more explicit control:
clean_df["gender_binary"] = clean_df["gender"].map({"male": 0, "female": 1})
replace() is more forgiving of unmapped values (they pass through unchanged); map() will set unmapped values to NaN, which is often safer because it surfaces categories you forgot to handle. Binary coding should match your instrument and analysis plan; don’t collapse a multi-category variable to binary just because it’s convenient.
Step 14: Remove Unnecessary Columns
clean_df = clean_df.drop(columns=["ip_address", "response_id_internal", "preview_flag"])
Survey platform exports often include timestamps, IP fields, preview flags, and distribution metadata that aren’t part of your analysis plan. Before dropping anything, confirm it’s genuinely irrelevant rather than a variable you might need for a later check (e.g., timestamps can help verify survey_date issues). Keep the untouched raw export regardless of what you drop from the working copy.
Step 15: Clean Dates
clean_df["survey_date"] = pd.to_datetime(clean_df["survey_date"], errors="coerce")

clean_df["survey_year"] = clean_df["survey_date"].dt.year
clean_df["survey_month"] = clean_df["survey_date"].dt.month
Only extract year/month/day components if your analysis actually uses them. Inconsistent date formats in the raw file (2024-03-01, 03/02/2024, 2024/03/03) are a common source of silent misparsing, so always spot-check a sample of converted dates against the originals.
Step 16: Check Range and Logical Consistency
Beyond single-column checks, validate relationships between columns:
# Example: a study close date rule
invalid_dates = clean_df["survey_date"] > pd.Timestamp("2024-03-31")

# Example: total score should equal the sum of item scores, if both exist
score_mismatch = clean_df["final_score"] != clean_df[["item1", "item2", "item3"]].sum(axis=1)
These rule-based checks catch errors that single-variable inspection misses entirely. A valid-looking age and a valid-looking date of birth can still be mutually inconsistent.
Data Cleaning for Survey and Dissertation Data
For dissertation and thesis researchers, cleaning has to preserve the logic of the study design, not just the technical validity of the data. Pay particular attention to:
- Participant IDs: confirm uniqueness matches your design (see Step 8).
- Incomplete responses: decide, per your protocol, at what completion threshold a response is usable.
- Duplicate submissions: common in online surveys; check by ID and by response pattern, not row equality alone.
- Missing questionnaire items: decide item-level vs. scale-level exclusion rules before you start deleting.
- Reverse-coded questions: must be reverse-scored correctly before computing scale totals (see below).
- Likert items: confirm the valid range matches the instrument.
- Attention checks: decide in advance how failed attention-check items affect inclusion.
- Computed scale scores: only compute after item-level cleaning, not before.
- Eligibility criteria: apply inclusion/exclusion rules explicitly and document how many cases each rule removed.
- Demographic categories: standardize to your codebook, not to whatever is convenient.
- Survey timestamps: useful for detecting rushed or duplicate responses.
A clean dataset should still reflect your methodology and codebook; cleaning doesn’t override the rules your study was designed around.
Cleaning Likert-Scale Data in Python
# Reverse-code an item on a 5-point scale (1 = low, 5 = high)
clean_df["item_reversed"] = 6 - clean_df["item_raw"]

# Check valid range before scoring
invalid_likert = ~clean_df["item_raw"].between(1, 5)
The formula 6 - original_score works because it maps 1 to 5 and 5 to 1, and 3 stays 3, on a 5-point scale (for a k-point scale, use k + 1 - score). Only reverse-score an item if the validated instrument’s scoring key specifies it. Reverse-coding an item that shouldn’t be reversed silently corrupts every scale score built from it.
Clean Data Before SPSS Analysis
If your workflow starts in Python but ends in SPSS, clean the dataset in pandas first, then export:
clean_df.to_csv("survey_data_clean.csv", index=False)
clean_df.to_excel("survey_data_clean.xlsx", index=False)
Both formats import into SPSS directly through File → Open → Data. Exporting straight to SPSS’s native .sav format from Python is possible with third-party libraries, but reliability varies by version. For most dissertation workflows, exporting to CSV or Excel and importing through SPSS’s own file-open dialog is the more dependable path. If you regularly work in SPSS after cleaning in Python, our guide on how to clean data in SPSS covers the equivalent checks using SPSS’s own tools.
Need help preparing a dissertation or thesis dataset for analysis? Our statisticians can review, clean, and code your data before you run tests. See SPSS data analysis help.
Complete Python Data Cleaning Example
import pandas as pd
import numpy as np

# 1. Load data
df = pd.read_csv("survey_data_raw.csv")

# 2. Preserve the raw copy
raw_df = df.copy()
clean_df = df.copy()

# 3. Standardize column names
clean_df.columns = clean_df.columns.str.strip().str.lower().str.replace(" ", "_")

# 4. Fix data types
clean_df["age"] = pd.to_numeric(clean_df["age"], errors="coerce")
clean_df["survey_date"] = pd.to_datetime(clean_df["survey_date"], errors="coerce")

# 5. Check missing values
print(clean_df.isna().sum())

# 6. Handle missing values (example: group-based imputation for one variable)
clean_df["satisfaction_score"] = clean_df["satisfaction_score"].fillna(
    clean_df.groupby("program")["satisfaction_score"].transform("mean")
)

# 7. Review duplicates by participant ID, not just full-row duplicates
duplicate_ids = clean_df.duplicated(subset=["participant_id"], keep=False)
print(clean_df[duplicate_ids])
clean_df = clean_df.drop_duplicates(subset=["participant_id"], keep="first")

# 8. Standardize categories
clean_df["gender"] = clean_df["gender"].str.strip().str.lower()
clean_df["program"] = clean_df["program"].str.strip().str.lower().replace({
    "business admin": "business",
})

# 9. Check valid ranges
invalid_scores = ~clean_df["final_score"].between(0, 100)
print(clean_df[invalid_scores])

# 10. Review outliers (IQR method)
q1, q3 = clean_df["final_score"].quantile([0.25, 0.75])
iqr = q3 - q1
outliers = clean_df[
    (clean_df["final_score"] < q1 - 1.5 * iqr) |
    (clean_df["final_score"] > q3 + 1.5 * iqr)
]
print(outliers)

# 11. Validate the final dataset
assert clean_df["age"].between(18, 100).all() or clean_df["age"].isna().any()
assert clean_df.duplicated(subset=["participant_id"]).sum() == 0

# 12. Export the clean dataset
clean_df.to_csv("survey_data_clean.csv", index=False)
Every variable used here (age, survey_date, satisfaction_score, participant_id, gender, program, final_score) was created or renamed in an earlier step, so nothing appears without being defined first.
Before and After Data Cleaning Example
| Problem | Raw data | Clean data | Action |
|---|---|---|---|
| Gender inconsistency | " female ", "FEMALE" | "female" | Trimmed and standardized to codebook category |
| Age stored as text | " 25" (string) | 25 (integer) | Converted with pd.to_numeric() |
| Score out of range | 130 | Flagged, not auto-deleted | Investigated against source before any decision |
| Duplicate participant | Repeated participant_id 1002 | Reviewed, one record kept | Resolved based on study design (not longitudinal) |
Validate Your Dataset After Cleaning
Cleaning isn’t finished until you confirm the result behaves as expected:
clean_df.info()
clean_df.isna().sum()
clean_df.duplicated().sum()
clean_df["gender"].value_counts()
clean_df.describe()
Add assertions that reflect your actual study rules, not generic boilerplate:
assert clean_df["age"].between(18, 100).all() or clean_df["age"].isna().sum() > 0
assert clean_df["final_score"].between(0, 100).all()
An assertion that fails is not a bug in your code; it’s the dataset telling you something still needs attention before analysis.
Create a Data Cleaning Log
This is the step that turns a cleaning script into something a supervisor, reviewer, or collaborator can actually audit.
| Date | Variable | Problem | Rule applied | Rows affected | Decision | Reason |
|---|---|---|---|---|---|---|
| 2026-03-01 | gender | 3 spellings of “female” | Standardize to lowercase, codebook categories | 187 | Recoded | Matches instrument category list |
| 2026-03-01 | participant_id | Repeated ID 1002 | Check design; not longitudinal | 1 | Removed duplicate, kept first | Design specifies single time point |
| 2026-03-01 | final_score | Value 130 on 0 to 100 scale | Flag, verify against source | 1 | Corrected to 78 after source check | Data-entry transcription error |
Keeping this log matters for:
- writing a defensible dissertation methods/results chapter
- reproducibility if you or a collaborator revisit the data later
- responding to a supervisor’s question about sample size or exclusions
- any audit or peer-review process that asks how the data was prepared
Save the Clean Dataset
clean_df.to_csv("survey_data_clean.csv", index=False)
clean_df.to_excel("survey_data_clean.xlsx", index=False)
Never overwrite the raw file. If you need to redo a step differently later, raw_df (or the original file on disk) is the only way back.
Common Python Data Cleaning Mistakes
| Mistake | Why it’s a problem | Better approach |
|---|---|---|
| Deleting all missing values | Can shrink sample size and bias results if missingness isn’t random | Assess missingness pattern first; choose deletion or imputation deliberately |
| Replacing all missing values with the mean | Shrinks variance, distorts distribution shape | Use group-based or method-appropriate imputation, and justify it |
| Deleting every statistical outlier | Removes legitimate extreme observations, not just errors | Investigate before deciding: verify, correct, retain, or remove with reason |
| Removing duplicate IDs without checking study design | Can delete legitimate repeated measurements | Check whether the design expects repeated IDs before deduplicating |
| Modifying the raw dataset directly | No way to recover the original if a decision needs revisiting | Always work on a copy; keep the raw file untouched |
| Ignoring data types | Leads to failed functions or silently wrong statistics | Check .info() and convert explicitly with pd.to_numeric() / pd.to_datetime() |
| Ignoring blank strings | Pandas won’t treat "" as missing automatically | Explicitly replace blanks and coded missing values per your codebook |
| Cleaning without a codebook | Standardization becomes arbitrary and inconsistent | Standardize categories against the instrument’s defined values |
| Changing values to improve significance | Undermines research validity; a form of data manipulation | Never adjust data based on the outcome it produces |
| Failing to document exclusions | Impossible to justify sample size in a methods section | Keep a data cleaning log for every rule applied |
| Cleaning each variable with inconsistent rules | Produces a dataset that isn’t internally coherent | Apply consistent, documented rules across variables |
| Exporting without validating | Errors carry forward into analysis undetected | Run validation checks before saving the final file |
Python Data Cleaning Cheat Sheet
| Task | pandas command | Purpose |
|---|---|---|
| Preview data | df.head() | First rows, quick sanity check |
| Structure overview | df.info() | Types and non-null counts |
| Summary statistics | df.describe() | Range, mean, distribution shape |
| Count missing values | df.isna().sum() | Missingness per column |
| Fill missing values | df.fillna(value) | Targeted imputation |
| Drop missing values | df.dropna() | Remove incomplete rows/columns |
| Find duplicate rows | df.duplicated() | Flag repeated rows |
| Remove duplicates | df.drop_duplicates() | Deduplicate the dataset |
| Convert type | df["col"].astype(type) | Explicit type conversion |
| Convert to numeric | pd.to_numeric(df["col"], errors="coerce") | Fix numeric columns stored as text |
| Convert to datetime | pd.to_datetime(df["col"], errors="coerce") | Fix inconsistent date formats |
| Replace values | df.replace({...}) | Recode categories or placeholder codes |
| Count category values | df["col"].value_counts() | Spot inconsistent categories |
| Range check | df["col"].between(a, b) | Flag out-of-range values |
| Drop columns | df.drop(columns=[...]) | Remove irrelevant fields |
| Rename columns | df.rename(columns={...}) | Standardize column names |
| Save clean file | df.to_csv(path, index=False) | Export a clean, shareable copy |
Python vs. SPSS for Data Cleaning
| Feature | Python / pandas | SPSS |
|---|---|---|
| Automation | Script-based; easy to rerun on updated data | Syntax files offer similar automation, less common in point-and-click use |
| Reproducibility | High; the script is the documentation | High if syntax is saved and used consistently |
| Learning curve | Steeper for non-programmers | Lower for GUI-based workflows |
| Large or repeated workflows | Scales well across many files or waves | Can become repetitive without syntax automation |
| Interface | Code-based | Menu/GUI-based, with optional syntax |
| Research familiarity | Growing, especially in newer programs | Long-established in social science, psychology, nursing, education |
Neither tool is universally better. The right choice depends on your program’s requirements, your supervisor’s expectations, and whether your workflow needs to scale beyond a single dataset.
When Should You Ask for Data Cleaning Help?
This tutorial covers the workflow that handles most dissertation and thesis datasets. Professional support becomes genuinely useful when a project involves:
- complex or unclear missing-data patterns across many variables
- poorly coded survey exports that don’t match the original questionnaire
- multi-wave or repeated-measures data with inconsistent participant tracking
- merging several datasets collected at different times or from different sources
- ambiguous questionnaire coding with no available codebook
- supervisor-requested revisions to an already-submitted results chapter
- cleaning decisions that need to hold up before regression, ANOVA, or factor analysis
- genuine uncertainty about inclusion/exclusion rules for the sample
If your dataset falls into one of these categories, our team can help review, clean, and prepare it before you move into formal analysis. See dissertation data analysis help.
Conclusion
A defensible Python data-cleaning workflow starts with understanding what each variable is supposed to represent, not with a generic checklist. It means defining cleaning rules before applying them, fixing actual errors rather than anything that merely looks unusual, preserving legitimate but unusual observations, documenting every decision, validating the final dataset against your own study rules, and keeping the raw file untouched throughout. Pandas gives you the tools to do all of this quickly and reproducibly, but the judgment behind each decision still has to come from your research design, not from a default function argument.
If you’ve worked through this tutorial and your dataset still raises questions you’re not confident answering (an unclear missing-data pattern, an ambiguous duplicate, a scale that doesn’t score the way your instrument describes), that’s a reasonable point to bring in a second set of eyes. Our team can help you move from a cleaned dataset to a defensible Chapter 4.
Frequently Asked Questions
The most reliable starting point is pandas: load the file, inspect it with .info() and .isna().sum(), fix data types, handle missing values deliberately, remove true duplicates, and standardize categorical values before analysis.
Pandas is the standard choice for tabular data cleaning. NumPy supports it under the hood, and SciPy or scikit-learn add specific tools, like z-score calculations or imputers, when a project needs them.
Use df.isna().sum() to count missing values per column, or df.isna().mean() * 100 for the percentage missing. Remember that blank strings and coded placeholders like 999 aren’t recognized as missing automatically.
It depends on how much is missing, why, and what analysis follows. Small amounts of random missingness on non-key variables can often be imputed; missingness tied to the value itself needs more careful handling, and blanket deletion or mean-replacement should never be a default.
Use df.drop_duplicates() for exact duplicate rows, or df.duplicated(subset=["id_column"]) to check duplicates by a specific identifier. Always confirm repeated IDs aren’t legitimate repeated measurements before removing them.
Two common approaches are the IQR method (values beyond 1.5× the interquartile range) and z-scores (values with |z| > 3, using SciPy). Flag these for investigation rather than deleting them automatically.
Yes. Clean and export the dataset from pandas as a CSV or Excel file, then open it in SPSS through File → Open → Data. This is a common workflow for researchers who prefer Python for preprocessing and SPSS for final statistical testing.
When .info(), .isna().sum(), and .duplicated().sum() match your expectations, categorical values are consistent with your codebook, range checks pass, and you’ve documented every decision in a cleaning log, the dataset is ready for analysis.
