
Hypothesis testing in SPSS is a core part of dissertation statistics, but many students struggle with choosing the correct test, checking assumptions, and interpreting their results. This step-by-step guide walks you through the entire hypothesis testing process in SPSS, from forming hypotheses to writing APA-style results.
Understand What Hypothesis Testing Means
Before using SPSS, you must understand what you’re testing.
- Null Hypothesis (H₀): There is no effect, no relationship, or no difference.
- Alternative Hypothesis (H₁): There is an effect, a relationship, or a difference.
Example:
H₀: Males and females do not differ in motivation scores.
H₁: Males and females differ in motivation scores.
SPSS helps you decide which hypothesis is supported by your data.
Identify Your Variables and Their Types
Hypothesis testing depends on your variable types:
| Variable Type | Description | Example |
|---|---|---|
| Nominal | Categories | Gender, Marital Status |
| Ordinal | Ranked categories | Likert scales |
| Scale | Numeric measurement | Age, Income, Motivation score |
Choose the Correct Hypothesis Test in SPSS
Selecting the right test is the most important part of hypothesis testing.
Here is a simple decision guide:
| Research Goal | SPSS Test |
|---|---|
| Compare 2 independent groups | Independent t-test |
| Compare 1 group before/after | Paired t-test |
| Compare 3 or more groups | One-Way ANOVA |
| Test relationship strength | Pearson or Spearman correlation |
| Test association between categories | Chi-Square test |
| Predict an outcome | Regression analysis |
Check Assumptions Before Running the Test
SPSS will run a test even if assumptions are violated but your results will be invalid.
- Normality: Use Shapiro–Wilk or Kolmogorov–Smirnov.
- Homogeneity of Variance: Use Levene’s Test (important for t-tests, ANOVA).
- Linearity: Use scatterplots (important for regression and correlation).
- No Multicollinearity: Check VIF values in regression.
- Independence of Observations
If assumptions fail → use non-parametric tests (Mann–Whitney, Kruskal–Wallis, Spearman).
Run the Hypothesis Test in SPSS
Below is how to run each major test.
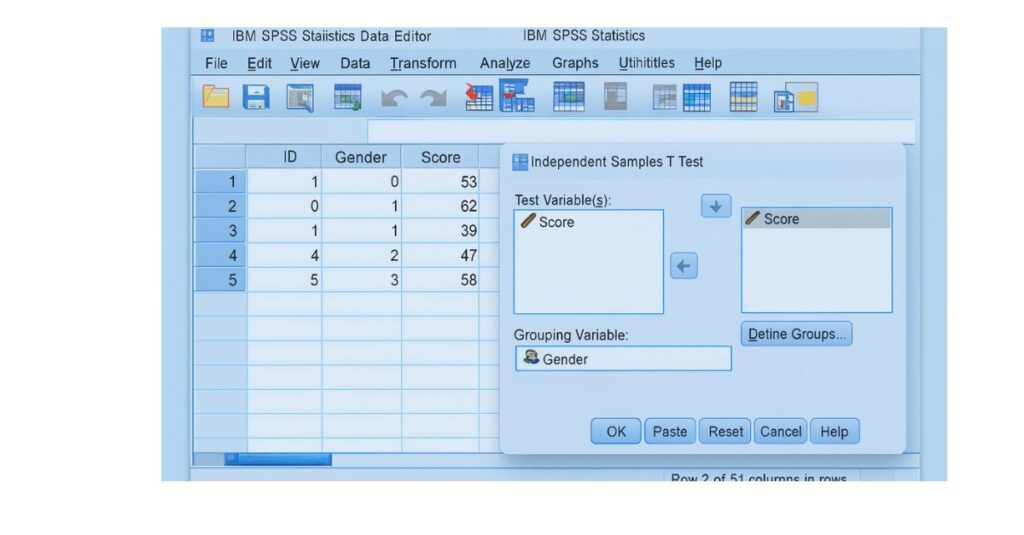
A. Independent Samples t-Test
Research Example: Compare male vs. female scores.
Steps:
- Click Analyze
- Select Compare Means
- Choose Independent Samples t-Test
- Move your dependent variable to Test Variable
- Move your group variable (e.g., gender) to Grouping Variable
- Define groups
- Click OK
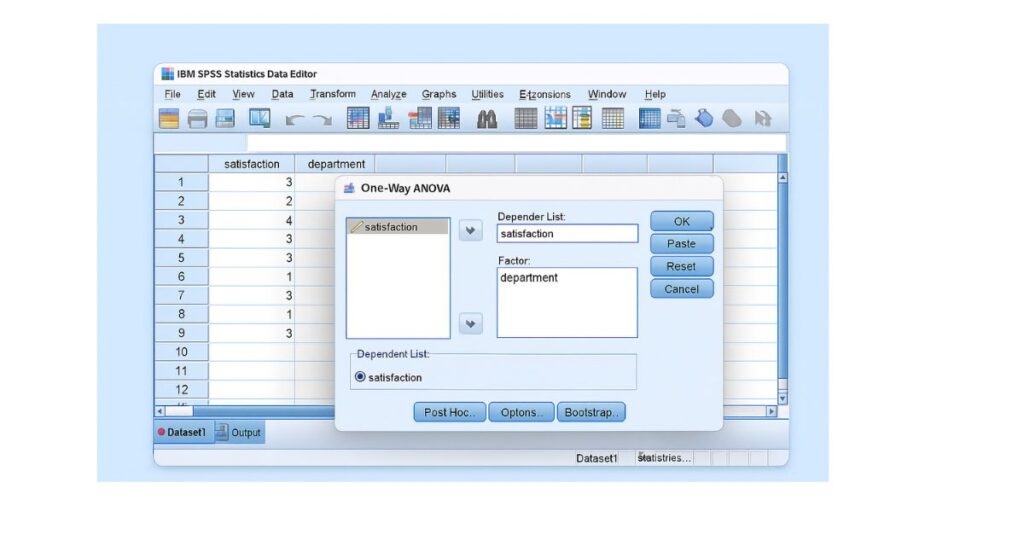
B. One-Way ANOVA
Research Example: Compare satisfaction across 3 departments.
Steps:
- Go to Analyze → Compare Means → One-Way ANOVA
- Move DV to Dependent List
- Move IV to Factor
- Click Post Hoc (Tukey recommended)
- Click Ok
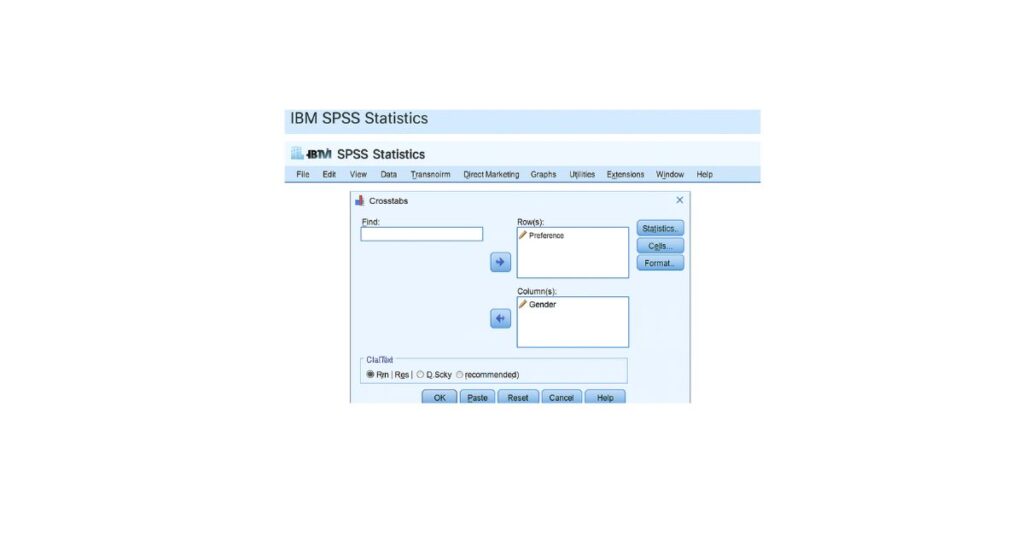
C. Chi-Square Test
Research Example: Association between gender and preference.
Steps:
- Go to Analyze → Descriptive Statistics → Crosstabs
- Place variables in rows and columns
- Click Statistics
- Select Chi-square
- Click Ok
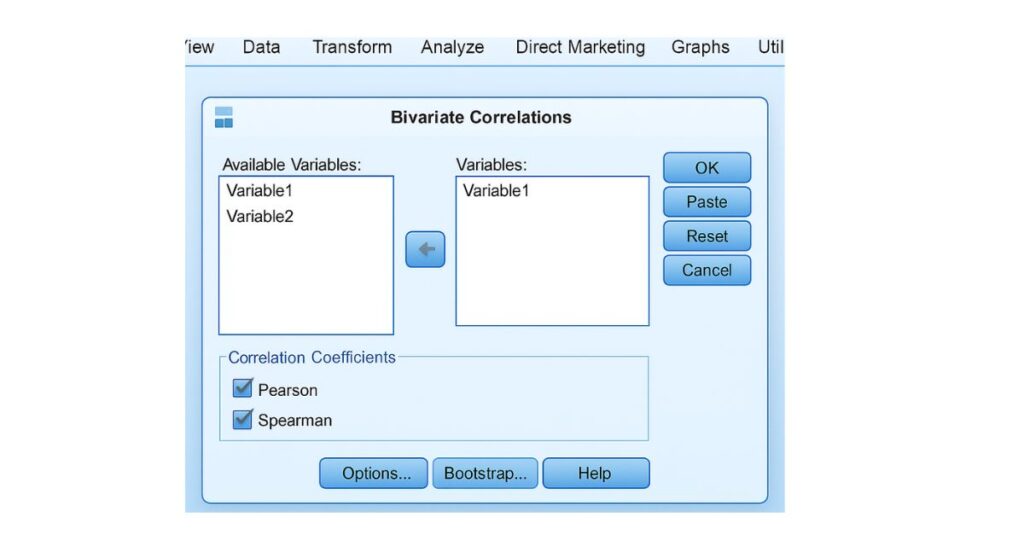
D. Correlation (Pearson or Spearman)
Steps:
- Go to Analyze → Correlate → Bivariate
- Select variables
- Choose Pearson (normal data) or Spearman (ordinal/non-normal)
- Click OK
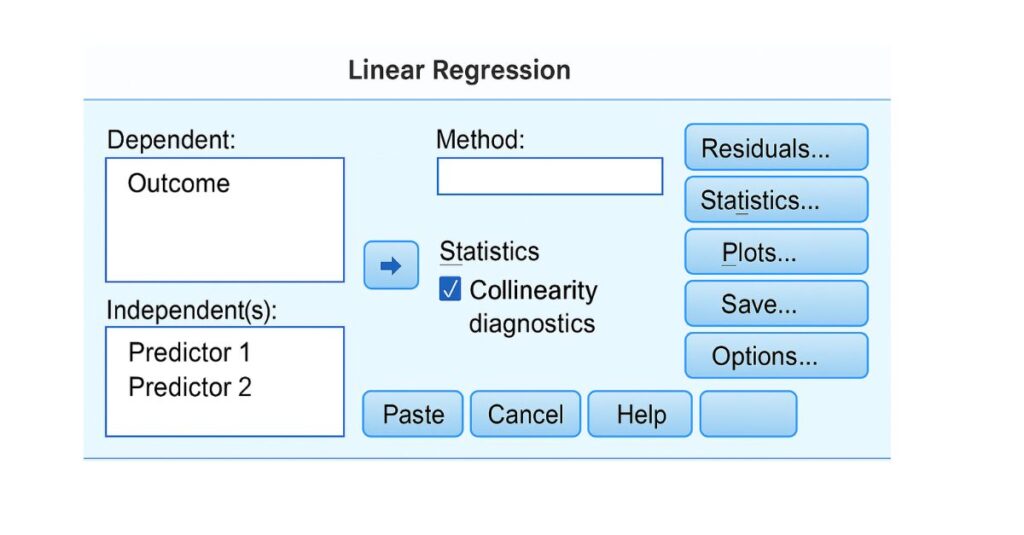
E. Regression Analysis
Steps:
- Go to Analyze → Regression → Linear
- Move DV to Dependent
- Move predictors to Independent(s)
- Click Statistics → Collinearity diagnostics
- Run model
Interpret SPSS Output Correctly
After running your statistical test in SPSS, the next step is interpreting the output. This is often where students feel overwhelmed because SPSS generates multiple tables containing means, variances, test statistics, confidence intervals, and p-values. However, the core purpose of hypothesis testing remains the same: determining whether there is enough evidence to reject the null hypothesis (H₀).
- Understanding the p-value: The p-value tells you the probability of observing your data if the null hypothesis were true. It does not tell you the size of the effect, the importance of the findings, or whether your hypothesis is “right” or “wrong.” It only indicates statistical evidence.
- Decision Rule: If p < .05
→ The result is statistically significant.
→ Reject the null hypothesis (H₀).
→ Your data supports the alternative hypothesis (H₁). - If p > .05
→ The result is not statistically significant.
→ Fail to reject the null hypothesis (H₀).
→ There is no evidence to support H₁. - Understanding Effect Size
A p-value alone does not show how strong an effect is. Many SPSS tests also include:
- Eta squared (η²) for ANOVA
- Cohen’s d for t-tests
- Correlation coefficient (r)
- Beta coefficient (β) for regression
These values help determine the practical significance of results.
5. Examples of Interpretation
T-Test Output Example
p = 0.012
There is a significant difference between the two groups.
This means group membership influences the dependent variable.
ANOVA Output Example
p = 0.640
There is no significant difference among the three departments.
Even if means differ slightly, those differences are not statistically meaningful.
Correlation Output Example
r = .45, p < .001
A moderate positive relationship exists between the variables.
Students with higher values on Variable A tend to have higher values on Variable B.
Regression Output Example
β = .32, p = .004
The predictor significantly influences the outcome variable.
A higher value of the predictor leads to an increase in the dependent variable.
6.Why This Step Matters
Interpreting SPSS results correctly ensures:
- Accurate dissertation writing
- Correct conclusions
- Fewer supervisor corrections
- Stronger arguments in the discussion chapter
7. Write Your Results in APA Style
Most universities require that hypothesis testing results be presented using APA 7th edition formatting. APA style ensures clarity, consistency, and professionalism in reporting statistical results.
8. Key Elements to Include in APA Reporting
- Test statistic (t, F, χ², β)
- Degrees of freedom (df)
- p-value
- Effect size (if available)
- Group means and standard deviations (for t-tests and ANOVA)
- Correlation coefficient (r)
- Clear and concise interpretation
Examples for Each Test Type
T-Test (APA Example)
An independent samples t-test revealed that females (M = 22.5, SD = 2.7) reported significantly higher motivation than males (M = 19.4, SD = 3.1), t(98) = 4.21, p < .001. These results indicate that gender has a meaningful effect on motivation levels.
ANOVA (APA Example)
A one-way ANOVA found no significant difference in satisfaction across the three departments, F(2, 87) = 1.14, p = .324. This suggests that employees reported similar satisfaction levels regardless of department.
Correlation (APA Example)
A Pearson correlation analysis revealed a moderate positive relationship between stress and workload, r(120) = .42, p < .001. As workload increases, stress levels tend to increase as well.
Regression (APA Example)
A multiple regression analysis showed that workload significantly predicted stress levels, β = .38, t(118) = 3.92, p < .001, indicating that higher workload is associated with higher reported stress.
Why APA Matters
Correct APA reporting:
- Increases academic credibility
- Reduces supervisor revisions
- Ensures clarity for readers
- Meets thesis/dissertation guidelines
Common Mistakes to Avoid in Hypothesis Testing in SPSS
Students frequently make avoidable mistakes that lead to incorrect results or poor grades. Understanding these mistakes in advance can save hours of revision.
1. Running the wrong statistical test: Choosing ANOVA instead of t-test, Pearson instead of Spearman, etc.
2. Not checking assumptions: Even the best test becomes invalid if normality or homogeneity assumptions fail.
3. Coding variables incorrectly: Text instead of numeric coding, inconsistent labels, or missing values coded wrongly.
4. Misreading SPSS output: Confusing Sig. (p-value) with descriptive statistics.
5. Using parametric tests on non-normal data: Can lead to misleading conclusions.
6. Reporting p-values incorrectly: E.g., writing “p = .000” instead of “p < .001.”
7. Failing to include effect sizes: Important for understanding the magnitude of findings.
8. Writing hypotheses in the wrong direction: E.g., using directional wording when test is two-tailed.
9. Not cleaning the dataset before analysis: Outliers and missing values distort results.
10. Running analyses without understanding variable types: Ordinal variables treated as scale, nominal as ordinal, etc.
Avoiding these mistakes leads to stronger, defensible, and more accurate research conclusions.
Example Scenario
Below is a realistic dissertation-style example to help you understand how hypothesis testing works from start to finish.
Research Question
Does study time predict exam performance among university students?
Variables
- Study time: continuous (scale)
- Exam score: continuous (scale)
Correct Test
Simple linear regression
Hypotheses
- H₀: Study time does not predict exam scores.
- H₁: Study time predicts exam scores.
Steps in SPSS
- Analyze → Regression → Linear
- Move “Exam Score” to Dependent
- Move “Study Time” to Independent(s)
- Click Statistics → Check Collinearity Diagnostics
- Run the model
Outcome Interpretation
- β = .47, p < .001
- As study time increases, exam scores also increase significantly.
- The model explains a meaningful portion of score variance.
Conclusion
There is strong evidence that study time is a statistically significant predictor of academic performance.
Reject H₀.
Final Tips for Perfect Hypothesis Testing
To master hypothesis testing in SPSS and avoid errors, keep the following best practices in mind:
1. Always start with data screening: Check for missing values, outliers, and unusual patterns.
2. Understand measurement levels: Nominal, ordinal, or scale — these determine the correct test.
3. Check assumptions carefully: Normality, homogeneity, independence, linearity, and multicollinearity.
4. Use non-parametric tests when necessary: If assumptions fail, alternatives like Mann–Whitney or Spearman are often safer.
5. Remove outliers only when justified: Document every decision for transparency.
6. Always report test statistics, not just p-values: Readers must see the complete statistical picture.
7. Ensure interpretation aligns with research questions: Connect findings back to theory, literature, and hypotheses.
8. Write clear, concise APA-style results: Academic writing requires precision.
9. Double-check variable coding before running tests: Incorrect coding leads to invalid results.
10. Practice makes perfect: The more tests you run and interpret, the more confident you become.
Mastering these principles ensures accurate analysis and a strong dissertation that withstands academic scrutiny.