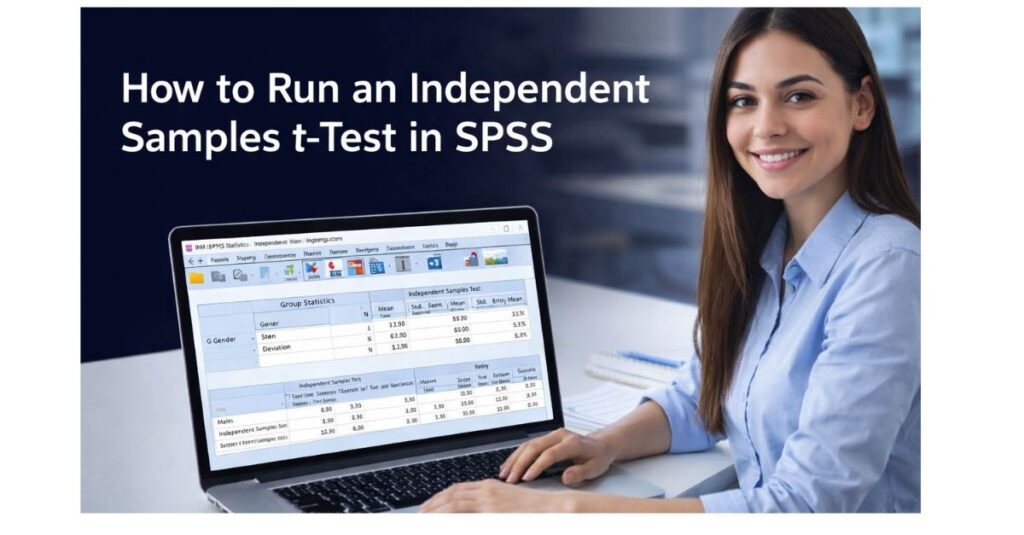
How to Run an Independent Samples t-Test in SPSS: A Complete Step-by-Step Guide
An independent samples t-test is one of the most widely used statistical procedures in SPSS. It allows researchers to determine whether there is a statistically significant difference between the mean scores of two independent groups. Because of its simplicity and effectiveness, this test is frequently applied in academic research, dissertations, coursework, business analytics, psychology, health sciences, and social science studies.
This guide provides a well-structured, detailed, and comprehensive explanation of how to run an independent samples t-test in SPSS. It covers the conceptual background, assumptions, data preparation, step-by-step execution, output interpretation, and APA-style reporting, making it suitable for students and researchers at all levels.
1. Understanding the Independent Samples t-Test
The independent samples t-test is used when a researcher wants to compare the average (mean) values of a continuous variable between two separate and unrelated groups. The key feature of this test is that each observation belongs to only one group, and no participant appears in both groups.
For example, an independent samples t-test can be used to compare:
- Exam scores of students taught using online learning versus in-person learning
- Stress levels of male versus female participants
- Sales performance of employees in Department A versus Department B
- Patient recovery time for a treatment group versus a control group
The purpose of the test is to determine whether any observed difference between the two group means is large enough to be considered unlikely due to random chance.
2. When to Use an Independent Samples t-Test
Before running the test in SPSS, it is essential to confirm that your data meets the required conditions.
You should use an independent samples t-test when:
- The dependent variable is continuous: Examples include test scores, income, satisfaction ratings, reaction time, or scale totals.
- The independent variable has exactly two groups: Examples include gender (male/female), group (control/treatment), or method (traditional/online).
- The observations are independent: Each participant or case belongs to only one group.
- The data is approximately normally distributed: This assumption is especially important when sample sizes are small.
- Homogeneity of variance is assumed : The variability of scores should be roughly equal across groups.
SPSS automatically tests the last assumption using Levene’s Test for Equality of Variances.
3. Preparing Your Data in SPSS
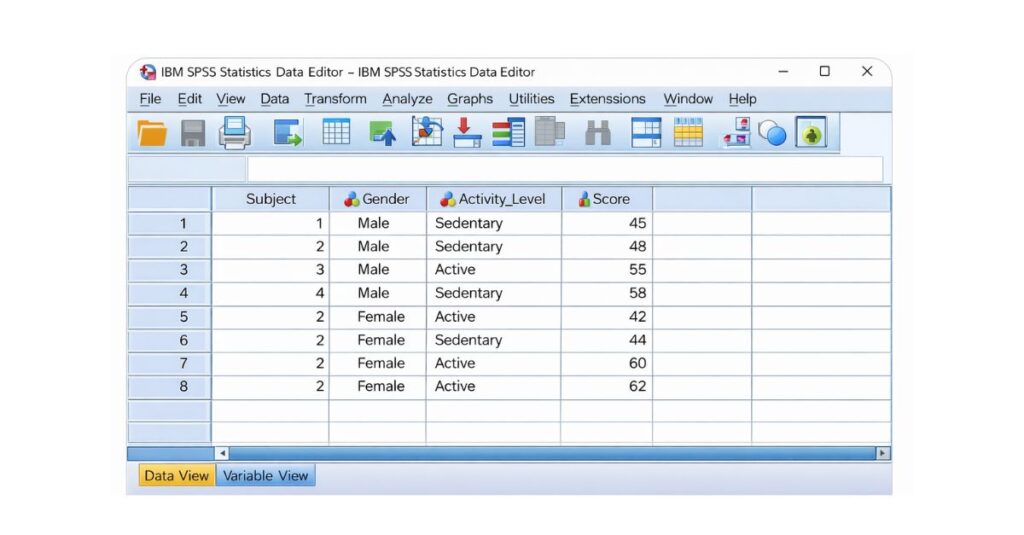
Data Structure
- Each row represents one participant or observation.
- Each column represents one variable.
Example Variables
Stress_Score→ Dependent variable (continuous)Gender→ Independent variable (coded numerically)
Variable View Settings
In Variable View, ensure that:
- The dependent variable has Measure = Scale
- The grouping variable has Measure = Nominal
- The grouping variable is numerically coded (e.g., 1 = Male, 2 = Female)
- Value labels are clearly defined for the grouping variable
Incorrect variable measurement settings are a common cause of errors, so this step should not be skipped.
4. Accessing the Independent Samples t-Test in SPSS
Once your data is prepared, follow this menu path in SPSS:
Analyze → Compare Means → Independent-Samples T Test
This opens the Independent Samples t-Test dialog box, where you specify the variables needed for the analysis.
5. Assigning Variables in the Dialog Box
Inside the dialog box:
- Move the dependent variable into the Test Variable(s) box.
- Move the independent (grouping) variable into the Grouping Variable box.
- Click Define Groups.
In the Define Groups window:
- Enter the numeric codes used for your two groups exactly as they appear in the dataset (for example, Group 1 = 1 and Group 2 = 2).
- Click Continue.
Correctly defining groups ensures SPSS compares the intended categories.
6. Running the Test
After assigning all variables:
- Click OK.
SPSS will process the data and display the results in the Output Viewer. No additional commands or syntax are required for a basic independent samples t-test.
7. Understand the SPSS Output
SPSS produces two main tables that must be interpreted together.
7.1 Group Statistics Table
This table provides descriptive statistics for each group, including:
- Sample size (N)
- Mean
- Standard deviation
- Standard error of the mean
This information helps you understand the direction and size of the difference between groups before evaluating statistical significance.
7.2 Independent Samples Test Table
This table contains:
- Levene’s Test for Equality of Variances
- t statistic
- Degrees of freedom (df)
- Significance value (Sig. (2-tailed))
- Mean difference
- Confidence interval of the difference
8. Interpreting Levene’s Test for Equality of Variances
Levene’s Test determines whether the variability of scores is similar across groups.
- If p > .05
Variances are equal: Use the first row (“Equal variances assumed”). - If p < .05
Variances are unequal : Use the second row (“Equal variances not assumed”).
Selecting the correct row is essential because it affects the degrees of freedom and the validity of the results.
9. Interpreting the t-Test Results
The most important value in the table is Sig. (2-tailed).
- p < .05
There is a statistically significant difference between the group means.
The null hypothesis is rejected. - p ≥ .05
There is no statistically significant difference between the group means.
The null hypothesis is not rejected.
You should also report:
- The t value
- Degrees of freedom (df)
- Direction of the mean difference
10. Example Interpretation
Assume the output shows:
- Levene’s Test: p = .24
- t(58) = 2.31
- Sig. (2-tailed) = .024
This indicates that variances are equal and the difference between the two group means is statistically significant. The results suggest that the grouping variable has a meaningful effect on the dependent variable.
11. Reporting Results in APA Style
Clear reporting is required for assignments, dissertations, and academic publications.
APA Reporting Example
An independent samples t-test was conducted to compare stress scores between males and females. Results showed a statistically significant difference in stress levels, t(58) = 2.31, p = .024.
12. Common Errors to Avoid
- Using an independent samples t-test for more than two groups
- Forgetting to define grouping values
- Ignoring Levene’s Test
- Using categorical variables as dependent variables
- Reporting the wrong row of results
Avoiding these mistakes ensures accurate and defensible findings.
13. Conclusion
The independent samples t-test in SPSS is a fundamental statistical technique for comparing two groups. When data is properly prepared and assumptions are carefully checked, the test provides clear and reliable insights into group differences. Understanding how to run, interpret, and report this analysis is essential for academic success and professional research practice.