
Correlation analysis is one of the most widely used statistical techniques in SPSS, particularly in academic research, dissertations, and data-driven projects. Researchers use correlation analysis to assess whether two variables are related and to measure how strongly they move together. Although the method appears simple, many students misunderstand how correlation works, use it incorrectly, or misinterpret the results in their assignments and dissertations.
This comprehensive guide explains correlation analysis in SPSS from start to finish, using clear language and academically sound explanations. It covers what correlation is, when to use it, how to run correlation analysis in SPSS, how to interpret the output correctly, how to report results in APA style, and the most common mistakes students make. By the end of this guide, you will understand correlation analysis well enough to explain it confidently in assignments, theses, dissertations, and research papers.
What Is Correlation Analysis?
Researchers use correlation analysis to examine the relationship between two quantitative variables. The method measures both the strength and the direction of the relationship. In SPSS, researchers most commonly measure correlation using coefficients such as Pearson’s r or Spearman’s rho.
A correlation does not indicate causation. This is a critical point that many students misunderstand. Correlation only tells us whether variables move together, not whether one variable causes changes in another. For example, a strong correlation between study hours and exam scores does not prove that studying causes higher scores, even though the relationship may appear logical. If you need personalized assistance with your analysis or interpretation, you can contact us for SPSS help at any stage of your research.
Why Correlation Analysis Is Important in Research
Correlation analysis plays a crucial role in many research designs.Researchers often use correlation analysis as a preliminary step to explore relationships before conducting more advanced tests such as regression or structural equation modeling. In dissertations, researchers commonly apply correlation analysis to address research questions that focus on associations between variables.
Researchers use correlation analysis to:
- Explore relationships between variables
- Support or refute research hypotheses
- Identify variables for further analysis
- Describe patterns in data
Because of its widespread use, supervisors and examiners expect students to understand correlation analysis deeply, not just run it mechanically in SPSS.
Types of Correlation Analysis in SPSS
SPSS supports several types of correlation analysis, each suitable for different types of data and research questions.
Pearson Correlation
Researchers most commonly use Pearson correlation in SPSS to measure the linear relationship between two continuous variables. This method assesses how changes in one variable relate to changes in another. Pearson correlation also assumes that the variables follow a normal distribution and that the relationship between them is linear.
Pearson’s r ranges from −1 to +1. Values close to +1 indicate a strong positive relationship, values close to −1 indicate a strong negative relationship, and values close to 0 indicate little or no linear relationship.
Spearman Rank Correlation
Researchers use Spearman correlation as a non-parametric alternative to Pearson correlation when the data do not meet normality assumptions or when the variables are ordinal rather than continuous. This method measures the monotonic relationship between variables instead of limiting the analysis to strictly linear relationships.
Kendall’s Tau
Kendall’s tau is another non-parametric correlation coefficient, often used with small sample sizes or when there are many tied ranks in the data. It is less commonly used than Pearson or Spearman but is available in SPSS.
When to Use Correlation Analysis in SPSS
Correlation analysis is appropriate when your research question focuses on whether variables are related rather than whether one variable predicts or causes another. It is commonly used in psychology, business, education, health sciences, and social sciences.
You should use correlation analysis when:
- Both variables are quantitative or ordinal
- You want to examine association, not causation
- The data meet the assumptions of the chosen correlation test
If your goal is prediction or explanation, correlation analysis alone is not sufficient, and regression analysis may be more appropriate.
Assumptions of Correlation Analysis
Before conducting correlation analysis in SPSS, it is important to consider the underlying assumptions.
For Pearson correlation, the main assumptions include:
- Both variables are continuous
- The relationship between variables is linear
- The data are approximately normally distributed
- There are no extreme outliers
Spearman and Kendall correlations have fewer assumptions, making them useful when data do not meet the requirements for Pearson correlation.
Failing to check assumptions can lead to misleading results, even if SPSS produces a correlation coefficient.
How to Run Correlation Analysis in SPSS
Running correlation analysis in SPSS is straightforward, but understanding each step is essential for correct interpretation.
First, ensure that your data are correctly entered and that variables are properly labeled. Next, select the correlation procedure in SPSS and choose the appropriate correlation coefficient based on your data and assumptions. SPSS will then generate a correlation matrix showing the correlation coefficients, significance values, and sample sizes.
While SPSS makes it easy to generate results, interpretation requires careful attention to both the numerical values and the context of the research.
Understanding the Correlation Coefficient
The correlation coefficient indicates both the strength and direction of the relationship.
Direction of Correlation
- A positive correlation means that as one variable increases, the other variable also increases.
- A negative correlation means that as one variable increases, the other variable decreases.
- A zero or near-zero correlation suggests no linear relationship.
Strength of Correlation
Although interpretation varies slightly by discipline, the following guidelines are commonly used:
- 0.00–0.29: weak correlation
- 0.30–0.49: moderate correlation
- 0.50–0.69: strong correlation
- 0.70–1.00: very strong correlation
These values should be interpreted cautiously and in the context of the research field.
Statistical Significance in Correlation Analysis
In SPSS output, correlation coefficients are accompanied by significance values (p-values). The p-value indicates whether the observed correlation is statistically significant.
When the p-value falls below the chosen significance level, usually .05, researchers consider the correlation statistically significant. This means that the observed relationship is unlikely to have occurred by chance.
However, statistical significance does not imply practical importance. A small correlation can be statistically significant in large samples, while a strong correlation may not be significant in small samples.
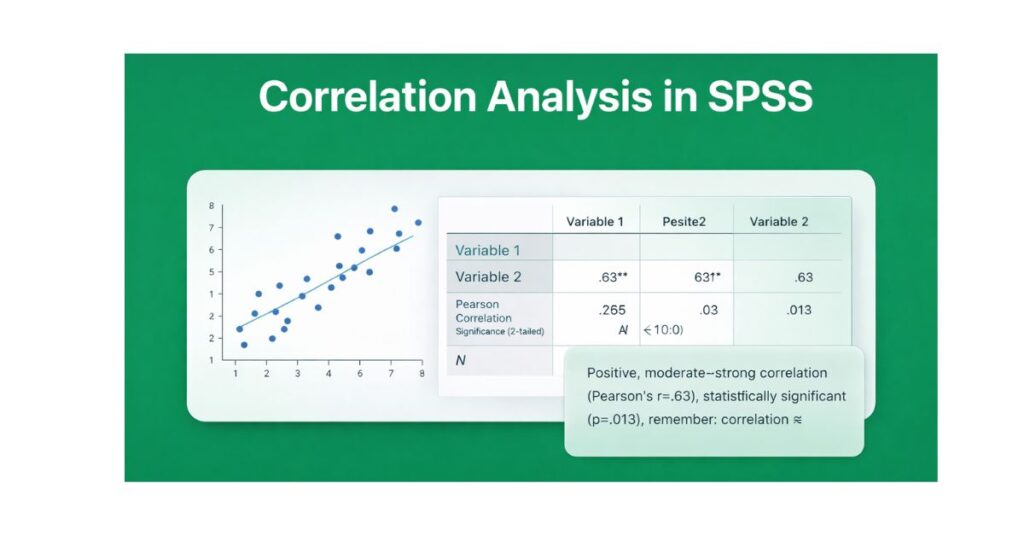
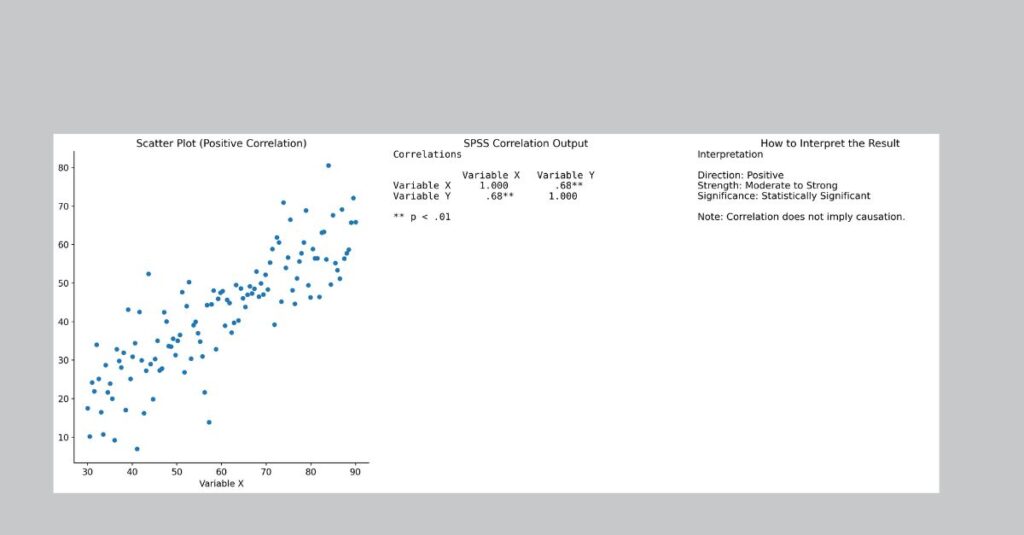
Interpreting Correlation Output in SPSS
Interpreting correlation analysis in SPSS involves more than stating whether the result is significant. A complete interpretation should include:
- The type of correlation used
- The value of the correlation coefficient
- The direction of the relationship
- The statistical significance
- The practical meaning of the relationship
A strong interpretation explains what the relationship means in real-world or theoretical terms, not just numerical values.
Correlation Matrix in SPSS
SPSS often presents correlation results in a matrix format when multiple variables are included. A correlation matrix displays correlations between all pairs of variables in the analysis.
When interpreting a correlation matrix, it is important to:
- Focus on relationships relevant to your research questions
- Avoid over-interpreting weak correlations
- Consider multicollinearity if correlations are very high
Correlation matrices are commonly used in dissertations to explore relationships before regression analysis.
Common Mistakes in Correlation Analysis
Many students make similar mistakes when working with correlation analysis in SPSS.
One common mistake is assuming that correlation implies causation. Some students also report correlation coefficients without explaining their meaning or practical implications.
Another frequent error is relying solely on statistical significance without considering the strength or direction of the relationship.
Avoiding these mistakes requires both statistical knowledge and careful interpretation.
Reporting Correlation Analysis in APA Style
When reporting correlation analysis in academic writing, researchers should present the results clearly and concisely while following APA guidelines.
A typical report includes:
- The type of correlation used
- The correlation coefficient
- The significance level
- A brief interpretation
For example, results might be reported as a significant positive correlation between two variables, including the correlation coefficient and p-value.
Clear reporting demonstrates strong understanding and improves the quality of your research.
Correlation vs Regression: Key Differences
Correlation analysis examines association, while regression analysis examines prediction. Correlation treats both variables symmetrically, whereas regression distinguishes between independent and dependent variables.
Understanding this distinction is essential when choosing the correct statistical method and explaining your analysis to supervisors or examiners.
Limitations of Correlation Analysis
Correlation analysis has several limitations that should be acknowledged in academic work.
It cannot establish causality, it is sensitive to outliers, and it only captures linear or monotonic relationships depending on the coefficient used. Non-linear relationships may go undetected in correlation analysis.
Recognizing these limitations strengthens your discussion section and shows critical thinking.
Using Correlation Analysis in Dissertations and Theses
Correlation analysis is commonly used in undergraduate, master’s, and doctoral research. In dissertations, it is often used to address relational research questions or to support further analyses.
When used properly, correlation analysis provides valuable insight into relationships between variables and lays the foundation for more complex statistical models.
Final Thoughts
Correlation analysis in SPSS is a powerful but often misunderstood statistical tool. Understanding how to choose the correct correlation coefficient, interpret the output accurately, and report results properly is essential for academic success.
By mastering correlation analysis, you move beyond simply running SPSS procedures and begin to think critically about data, relationships, and research questions. This skill is invaluable not only for completing assignments and dissertations but also for conducting meaningful research.