
How to Check for Multicollinearity in SPSS (Complete Guide for Students)
Written by Pius · Updated July 2026 · 12 min read
Same email, roughly every few weeks. Student sends a regression model. Everything looks clean, R squared is decent, and then the supervisor’s feedback comes back with one line: multicollinearity not addressed. Sometimes the model’s actually fine. Sometimes it isn’t. The check itself takes about two minutes in SPSS. Explaining what it means takes longer, which is really what this guide is for.
If you’d rather someone just look at your specific model, SPSS Dissertation Help can do that directly.
WHAT MULTICOLLINEARITY ACTUALLY IS
Two or more independent variables in a regression model, correlated with each other beyond a certain point. That’s it, that’s the whole definition, everything else is consequence.
Once predictors overlap that much, SPSS can’t cleanly tell you what each one is doing on its own, because they’re partly explaining the same variance. Practically, that shows up three ways. Coefficients swing in directions that don’t match the theory. Standard errors inflate, so a predictor that should matter tests as non-significant. And the model gets twitchy, pull ten cases out and the estimates move more than they should.
What it doesn’t do: hurt your overall model fit. R squared barely moves, sometimes not at all. Which is exactly why students miss it, the model still “looks good” by the metric they’re watching. What’s actually broken is the interpretability of individual predictors, and that’s a quieter kind of broken.
WHY IT’S WORTH TAKING SERIOUSLY
Skip it and you don’t just risk a comment in the margins, you risk conclusions that are wrong and you won’t know it. Coefficients flip sign against your own hypothesis. Predictors with real theoretical backing test as dead weight because their standard error got inflated by something else in the model. The whole thing gets fragile in a way that undercuts the reproducibility your methodology chapter is supposed to be arguing for in the first place.
Most rubrics flag this by name now, whenever there’s more than one predictor. If the regression mechanics themselves still feel shaky, How to Run Regression Analysis in SPSS is worth reviewing before stacking a diagnostic on top of something unsteady.
WHEN YOU ACTUALLY NEED THIS
More than one independent variable, full stop. Multiple linear regression, logistic regression, hierarchical regression, moderation or mediation, since interaction terms basically always correlate with their own components. Any regression-based chapter, really.
Not relevant to a simple two-variable correlation. That’s Correlation Analysis in SPSS territory instead, different question entirely.
WHERE IT USUALLY COMES FROM
Almost never a mistake in the analysis. It’s baked in earlier, at the point where the variables got chosen. Income and socioeconomic status in the same model. A total scale score sitting alongside its own subscales. A handful of survey items that are really one construct, entered separately instead of combined. An interaction term built from variables nobody centered first. Or, simplest of all, too many predictors for what the sample size and theory can actually carry.
Which one applies to you changes what the fix looks like. Worth figuring out before you run anything.
STEP BY STEP: CHECKING IT WITH VIF IN SPSS
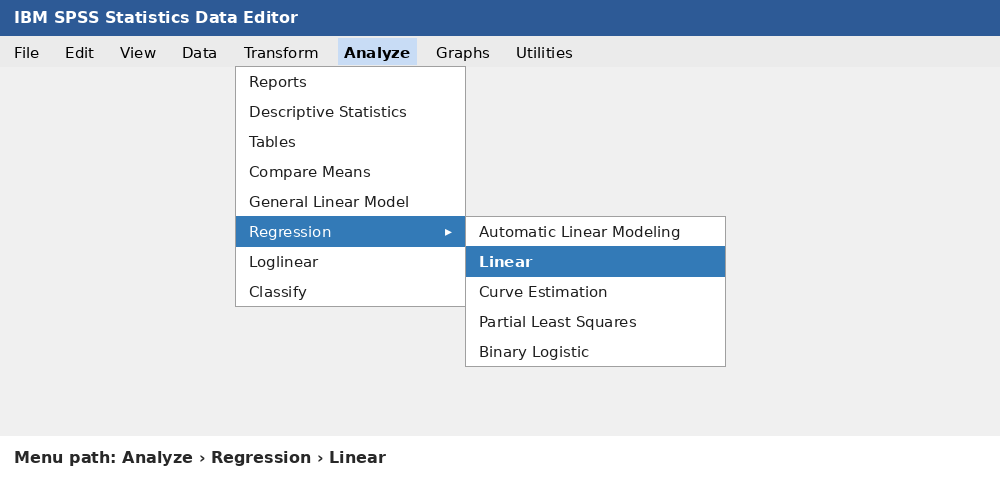
Step 1: Open the Linear Regression Menu
Analyze, then Regression, then Linear. Dependent variable into the Dependent box, everything else into Independent(s).
Step 2: Turn On Collinearity Diagnostics
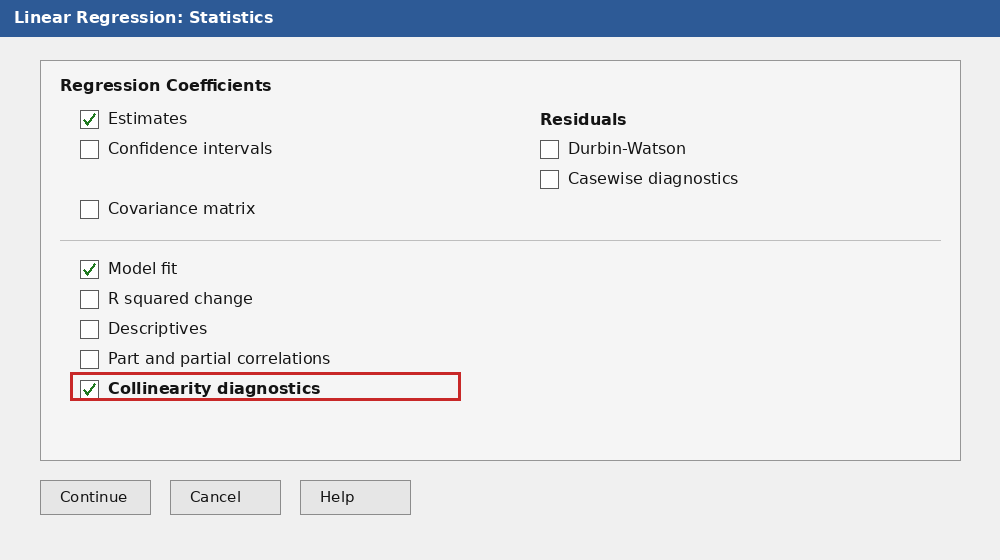
Click Statistics inside the dialog. Estimates and Model fit are on by default, leave them alone. Tick Collinearity diagnostics, that’s the checkbox that actually matters, it’s the only reason SPSS bothers calculating tolerance and VIF at all. Continue, then OK.
Step 3: Find Tolerance and VIF
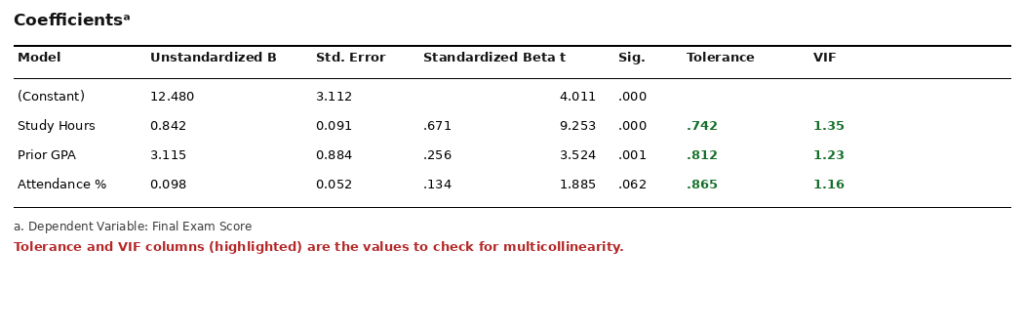
A handful of tables come out. Go to Coefficients, ignore the rest for this. Tolerance and VIF sit toward the right. Those two columns are the entire point of the exercise.
READING TOLERANCE
How much of a predictor’s variance is left after accounting for the others. High tolerance, standing on its own. Low tolerance, leaning hard on something else in the model.
Above 0.20, fine. Between 0.10 and 0.20, worth a mention, not fatal on its own. Below 0.10, a real problem, most institutions won’t wave it through without a correction.
READING VIF
Tolerance’s mirror image, mathematically its inverse, which is why the two always agree with each other and why examiners want both reported instead of just one.
Below 3, fine. 3 to 5, moderate, note it and move on. Above 5, a real issue. Above 10, severe. For dissertation work: keep it under 5, under 3 if your predictor list allows it.
A HYPOTHETICAL EXAMPLE
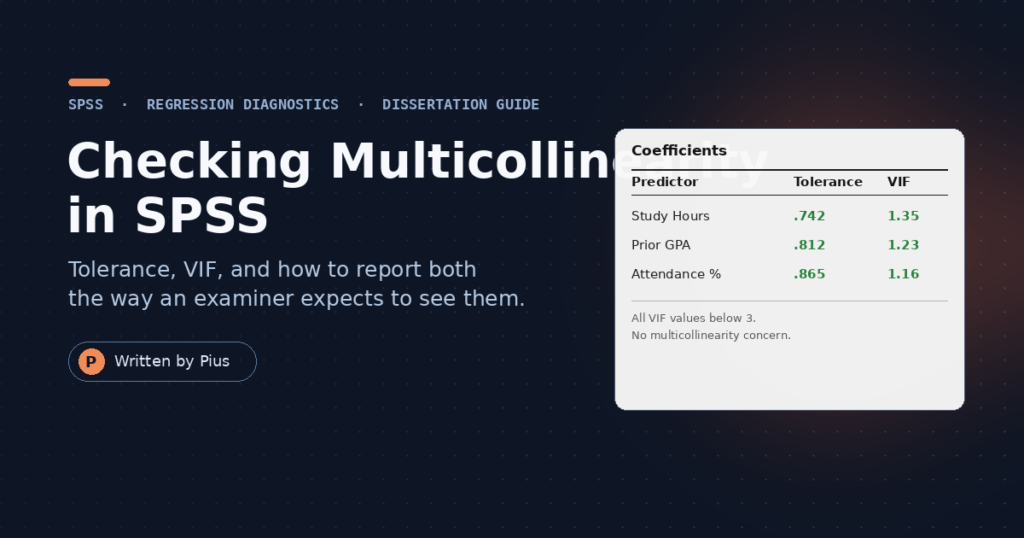
To be clear: not real data, just illustrative, so the reporting sentence has a shape to copy. Say a model predicting exam scores from study hours, prior GPA, and attendance came back with tolerance somewhere between 0.74 and 0.87, VIF around 1.2 to 1.4. The write-up sentence:
Multicollinearity was assessed using tolerance and variance inflation factor statistics. Tolerance values ranged from 0.74 to 0.87, and VIF values ranged from 1.16 to 1.35, all comfortably within acceptable limits, indicating multicollinearity was not a concern in this model.
One sentence, backed by your actual numbers. More on the broader formatting conventions at How to Report SPSS Results in APA Format.
USING A CORRELATION MATRIX FIRST
Common early step, eyeball the correlations among predictors before running anything. Above roughly 0.80 between two variables, look closer.
But that’s a first pass, not proof either way. A clean-looking matrix can still hide a multicollinearity problem once three or four predictors combine in one model, joint overlap that no single pairwise correlation catches on its own. Run the actual diagnostics regardless.
MODERATION MODELS MAKE THIS WORSE
Basically guaranteed here, since an interaction term is, by construction, correlated with the two variables multiplied to make it. Leave them uncentered, VIF on the interaction term inflates, and a real moderation effect can end up looking shaky when it isn’t.
Fix: mean-center both variables before building the interaction. Cuts the artificial correlation, doesn’t touch what the test is actually measuring. And don’t stack higher-order interactions unless the theory specifically calls for them, each one adds to the pile.
IF IT SHOWS UP, WHAT NOW
Depends on your design and theory, no universal answer. Drop a redundant predictor if two variables measure the same thing. Combine correlated items into a composite. Run a factor analysis to collapse several into fewer independent dimensions. Center variables if it’s an interaction term. Or keep the predictor anyway because the theory demands it, and say so plainly in your limitations.
Not sure which fits your case? Reasonable thing to ask SPSS Dissertation Help about before committing to a direction in the write-up.
REPORTING IT IN APA STYLE
Short. Multicollinearity was evaluated using tolerance and variance inflation factor values. All tolerance values were above 0.20 and VIF values were below 3, indicating no multicollinearity concerns. Full tables go in an appendix unless your department specifically wants them inline.
MISTAKES I SEE MOST
Skipping it entirely and hoping nobody asks. That one’s still the most common, somehow. Reporting a correlation matrix like it settles things. Getting the thresholds backwards under pressure, an easy thing to blank on in a viva. Cramming a model with predictors that are secretly measuring the same construct. Cutting a variable to fix a bad VIF with zero theoretical reason for why that specific variable got the axe, examiners catch that one almost every time.
MULTICOLLINEARITY ISN’T CORRELATION
Correlation, relationship between any two variables, nothing more. Multicollinearity, overlap among predictors inside a regression model specifically, and it can show up across three or four variables jointly in a way no pairwise correlation ever reveals on its own. Knowing the difference, and being able to say it out loud, is usually exactly what gets tested in a viva. Not a trick question. Just a check for whether you understand the methodology or followed a checklist.
WHAT EXAMINERS ACTUALLY WANT
Multiple predictors, regression at the center of the hypothesis testing, any moderation or mediation model, basically any quantitative dissertation by default. Missing it doesn’t read as a small oversight. It reads as a gap in understanding your own analysis, and that’s harder to talk your way out of in a defense than a number that just needs more explaining.
WHERE THIS LEAVES YOU
Minutes to check. Longer to actually understand what tolerance and VIF are telling you, and that’s the part that separates a chapter that survives a defense from one that gets sent back with a red flag on it. Want a second set of eyes on your own model? SPSS Dissertation Help can take a look.
FREQUENTLY ASKED QUESTIONS
Above 5, address it. Above 10, severe, don’t trust the coefficients until it’s dealt with.
No. Regression-specific, more than one predictor. A basic two-variable correlation is untouched by it.
Only if it doesn’t matter theoretically. Try centering, combining, or factor analysis first. Cutting a variable purely because its VIF looked bad, with nothing backing that decision, is a mistake examiners catch constantly.
Basically yes, even when everything comes back clean. One sentence confirming no concern is still expected.
No. It hands you the numbers. What you do with them is on you.
