
How to Do Exploratory Factor Analysis in SPSS: A Complete Step-by-Step Guide
Exploratory Factor Analysis (EFA) is one of the most widely used multivariate statistical techniques in social sciences, business, psychology, education, health sciences, and market research. When researchers work with questionnaires, surveys, or scales that contain many related variables, EFA helps identify the underlying latent factors that explain patterns of correlations among observed variables.
This guide provides a clear, practical, and academically sound explanation of how to conduct Exploratory Factor Analysis in SPSS, from conceptual understanding to final APA-style reporting. It is written for undergraduate students, postgraduate researchers, PhD candidates, and professionals who want accurate results and correct interpretation.
What Is Exploratory Factor Analysis?
Exploratory Factor Analysis is a data reduction and structure detection technique. Its purpose is to explore whether a large set of observed variables can be explained by a smaller number of unobserved variables called factors.
EFA is used when:
- You do not know the factor structure in advance
- You are developing or validating a questionnaire
- You want to identify dimensions within a construct
- You aim to reduce variables before regression, SEM, or clustering
Unlike Confirmatory Factor Analysis (CFA), which tests a predefined model, EFA allows the data to determine the structure.
When Should You Use Exploratory Factor Analysis?
You should use EFA when:
- Your study involves Likert-scale questionnaire items
- Variables are expected to be correlated
- You want to uncover latent constructs
- You are at an early stage of scale development
- Prior theory does not specify factor membership clearly
Typical examples include:
- Job satisfaction surveys
- Psychological trait measurements
- Customer perception studies
- Attitude and behavioral research
Key Assumptions of Exploratory Factor Analysis
Before running EFA in SPSS, you must ensure the data meets its assumptions. Ignoring these assumptions is one of the most common reasons students lose marks.
1. Level of Measurement
Variables should be:
- Continuous, or
- Ordinal Likert-scale items (treated as continuous)
2. Sample Size
General guidelines:
- Minimum: 100 cases
- Preferred: 5–10 participants per variable
- Strong analysis: 300+ cases
3. Adequate Correlations
- Variables must be reasonably correlated
- Correlations below .30 across most variables suggest EFA may not be suitable
Preparing Data for Exploratory Factor Analysis in SPSS
Data preparation is critical. A well-run EFA starts with clean, structured data.
Step 1: Check for Missing Values
- Use Analyze → Descriptive Statistics → Frequencies
- Ensure missing values are minimal
- Consider mean substitution or listwise deletion if appropriate
Step 2: Reverse Code Negative Items
- Items measuring the same construct must move in the same direction
- Incorrect coding leads to misleading factor loadings
Step 3: Screen for Outliers
- Use boxplots or z-scores
- Extreme outliers distort correlations and communalities
Step-by-Step: How to Run Exploratory Factor Analysis in SPSS
The following steps apply to IBM SPSS Statistics and are widely accepted in academic research.
Step 1: Open the Factor Analysis Dialog
- Click Analyze
- Select Dimension Reduction
- Choose Factor
Step 2: Select Variables
- Move all items you want to analyze into the Variables box
- Include only variables intended to measure related constructs
- Do not mix demographic variables with scale items
Step 3: Descriptives and Correlation Matrix
Click Descriptives and select:
- Initial solution
- Coefficients
- KMO and Bartlett’s test
These outputs help assess factorability.
Assessing Factorability: KMO and Bartlett’s Test
Before interpreting factors, you must confirm the data is suitable.
- Kaiser-Meyer-Olkin (KMO) Measure
- Indicates sampling adequacy.
| KMO Value | Interpretation |
|---|---|
| ≥ .90 | Excellent |
| .80–.89 | Very good |
| .70–.79 | Good |
| .60–.69 | Acceptable |
| < .60 | Problematic |
Rule: KMO should be ≥ .60.
- Bartlett’s Test of Sphericity
Tests whether the correlation matrix is significantly different from an identity matrix.
- p < .05 → suitable for EFA
- p > .05 → EFA not recommended
Choosing the Extraction Method
Click Extraction in SPSS.
Recommended Extraction Methods
Principal Axis Factoring (PAF)
- Best for identifying latent constructs
- Does not assume normality
- Preferred for academic research
Principal Component Analysis (PCA)
- Data reduction technique
- Often misused as EFA
- Use only if your goal is variable reduction, not theory building
Best practice: Use Principal Axis Factoring unless instructed otherwise.
Deciding the Number of Factors
This is one of the most important decisions in EFA.
Method 1: Eigenvalues Greater Than 1
- Retain factors with eigenvalues ≥ 1
- Common but can overestimate factors
Method 2: Scree Plot
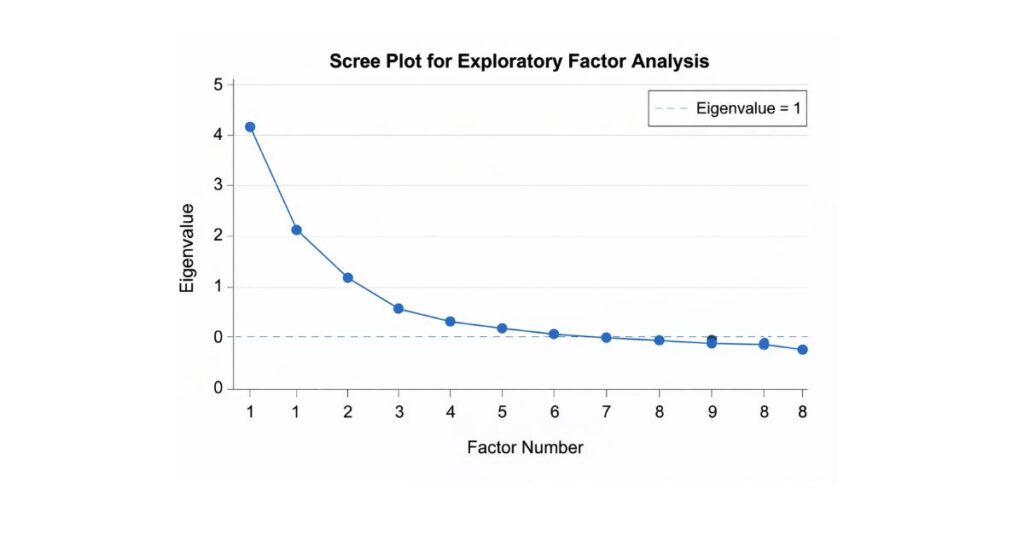
- Look for the “elbow”
- Retain factors above the point where the slope flattens
Method 3: Theoretical Interpretability
- Factors must make conceptual sense
- Statistical results must align with theory
Best practice: Use scree plot + theory, not eigenvalues alone.
Rotation: Making Factors Interpretable
Rotation improves clarity by simplifying factor structure.
Types of Rotation
Orthogonal Rotation (Varimax)
- Assumes factors are uncorrelated
- Easier to interpret
- Common in basic research
Oblique Rotation (Promax / Oblimin)
- Allows factors to correlate
- More realistic for social science research
- Produces pattern and structure matrices
Recommended: Use oblique rotation unless theory clearly states factors are independent.
Interpreting Factor Loadings
Factor loadings represent the relationship between variables and factors.
Acceptable Loading Thresholds
| Loading | Interpretation |
|---|---|
| ≥ .70 | Very strong |
| .50–.69 | Strong |
| .40–.49 | Acceptable |
| < .40 | Weak (consider removal) |
Cross-Loading Items
- Items loading ≥ .40 on multiple factors
- Indicates ambiguity
- Often removed to improve clarity
Communalities Explained
Communality shows how much variance in a variable is explained by the factors.
- Values ≥ .40 are desirable
- Low communalities suggest the item does not fit the factor model
Refining the Factor Model
EFA is an iterative process.
Steps to refine:
- Remove weak or cross-loading items
- Re-run the analysis
- Re-check KMO, variance explained, and factor interpretability
- Stop when a clear, stable solution emerges
Naming Factors Correctly
Factor names should:
- Reflect the common theme of items
- Be grounded in theory or literature
- Avoid vague labels like “Factor 1”
Example:
- Items on pay, benefits, and promotion → Compensation Satisfaction
- Items on autonomy and decision-making → Job Control
Reliability Analysis After EFA
After identifying factors, assess internal consistency.
- Go to Analyze → Scale → Reliability Analysis
- Run Cronbach’s alpha for each factor separately
Cronbach’s Alpha Guidelines
| Alpha | Interpretation |
|---|---|
| ≥ .90 | Excellent |
| .80–.89 | Good |
| .70–.79 | Acceptable |
| < .70 | Needs improvement |
How to Report Exploratory Factor Analysis in APA Style
Example APA Write-Up
An exploratory factor analysis using principal axis factoring with oblique rotation was conducted on 18 items. The Kaiser–Meyer–Olkin measure verified sampling adequacy (KMO = .82), and Bartlett’s test of sphericity was significant, χ²(153) = 1246.38, p < .001. Three factors were retained based on scree plot inspection, explaining 62.4% of the total variance. Factor loadings ranged from .52 to .81. All factors demonstrated acceptable reliability (α = .78–.86).
Common Mistakes Students Make in EFA
- Using PCA instead of EFA without justification
- Ignoring KMO and Bartlett’s test
- Keeping too many factors
- Reporting rotated and unrotated results incorrectly
- Failing to remove cross-loading items
- Not linking factors to theory
Avoiding these errors significantly improves academic quality and grades.
Frequently Asked Questions (FAQ)
Is PCA the same as Exploratory Factor Analysis?
No. PCA reduces variables; EFA identifies latent constructs.
Can I use EFA with small samples?
Small samples reduce reliability. Aim for at least 5–10 cases per variable.
Should I use Varimax or Promax?
Promax is preferred when factors are theoretically related.
Can EFA be used before regression?
Yes. EFA is often used to create factor scores for regression or SEM.
Final Thoughts
Exploratory Factor Analysis in SPSS is a powerful technique when applied correctly. Success depends not just on clicking the right buttons, but on understanding assumptions, making justified decisions, and interpreting results rigorously.
When conducted properly, EFA:
- Reveals meaningful constructs
- Strengthens scale validity
- Improves the quality of quantitative research
- Enhances credibility in dissertations, theses, and journal articles
If you apply the steps in this guide carefully, your analysis will meet academic standards, examiner expectations, and APA reporting requirements.