How to Enter Data for Two-Way ANOVA in SPSS: Complete Step-by-Step Guide
Entering data correctly is the most critical requirement for running a valid two-way ANOVA in SPSS. Many students believe their analysis is incorrect because of statistical complexity, when in reality the issue comes from improper data structure, incorrect factor coding, or wrong measurement levels. A two-way ANOVA is highly sensitive to how data is entered, and even a small mistake in Variable View can invalidate the entire output.
This in-depth guide explains how to enter data for a two-way ANOVA in SPSS from start to finish, using expanded explanations, structured tables, and clear screenshot references. The content is designed to meet undergraduate, postgraduate, and PhD-level academic standards, including dissertation and thesis requirements.
Understanding What a Two-Way ANOVA Requires
A two-way ANOVA, also known as a factorial ANOVA, is used when a researcher wants to examine how two independent categorical variables influence one continuous dependent variable. In addition to testing each independent variable separately, this analysis also evaluates whether the two variables interact, meaning the effect of one factor depends on the level of the other factor.
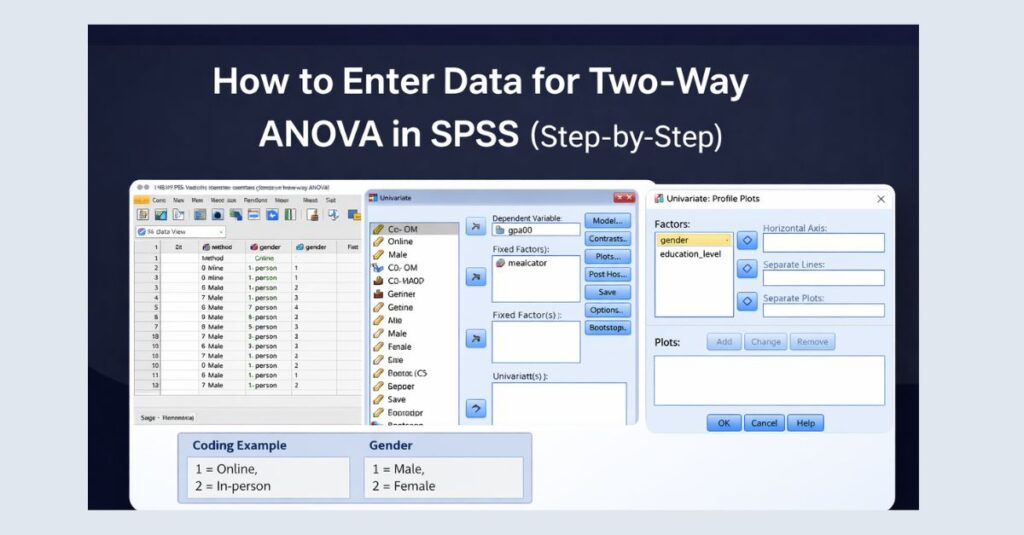
For example, a researcher may want to understand whether teaching method and gender affect student exam scores. The two-way ANOVA allows the researcher to test:
- The main effect of teaching method
- The main effect of gender
- The interaction between teaching method and gender
Without correct data entry, SPSS will either refuse to run the analysis or produce misleading results that are not accepted in academic grading.
Before Entering Data: Essential Preparation Rules
Before opening IBM SPSS Statistics, it is important to understand the fundamental structure that SPSS expects. Two-way ANOVA follows strict data formatting rules, and these rules must be respected before analysis begins.
First, each row must represent a single participant or observation. SPSS does not allow multiple rows for one participant in standard between-subjects ANOVA designs. Second, each column must represent one variable, whether that variable is the dependent variable or one of the factors. Third, all independent variables must be categorical, meaning they are entered as numbers with clearly defined value labels.
Failure to follow these rules often leads to common errors such as missing interaction terms, incorrect F-values, or invalid significance levels.
Step 1: Open SPSS and Create a New Dataset
Begin by opening SPSS and selecting File → New → Data. When a new dataset opens, SPSS automatically displays Data View, but data should never be entered immediately. Proper statistical work always starts in Variable View, where each variable is defined clearly before data entry begins.
The two tabs at the bottom of the SPSS window serve distinct purposes:
- Variable View is used to define variable names, labels, value labels, and measurement levels.
- Data View is used only after variables are fully defined.
Skipping Variable View is one of the most common mistakes students make.
Step 2: Identify the Required Variables for Two-Way ANOVA
A two-way ANOVA requires exactly three variables in its simplest form:
- One continuous dependent variable
- Two categorical independent variables (factors)
Each of these variables must be entered correctly for SPSS to recognize the factorial structure of the design. The dependent variable must be numeric and continuous, while the independent variables must be numeric codes representing categories.
Example Variable Overview
| Variable Role | Variable Name | Description |
|---|---|---|
| Dependent Variable | score | Student exam score |
| Factor A | method | Teaching method |
| Factor B | gender | Gender of participant |
Step 3: Define the Dependent Variable in Variable View
The dependent variable is the outcome being measured. In two-way ANOVA, this variable must be continuous. SPSS requires that the dependent variable be set to Scale, otherwise the analysis will not be statistically valid.
When defining the dependent variable:
- Assign a clear, short name such as
score - Use a descriptive label such as Exam Score
- Ensure the measurement level is set to Scale
This step is crucial because SPSS uses the measurement level to determine which statistical tests are available. If the dependent variable is mistakenly set to Nominal or Ordinal, the two-way ANOVA option may still appear but the output will be incorrect.
Step 4: Define Independent Variable 1 (Factor A)
The first independent variable represents one categorical factor in the study. This variable must be entered as numeric, even if it represents categories such as teaching methods or treatment groups.
For example, teaching method can be coded numerically as:
- 1 = Online
- 2 = In-person
In Variable View:
- Enter the variable name (e.g.,
method) - Add a clear label
- Define value labels carefully
- Set the measurement level to Nominal
SPSS relies entirely on numeric coding for categorical variables. Text-based entries such as “Online” or “In-person” will cause SPSS to treat the variable as string data, which cannot be used in ANOVA.
Step 5: Define Independent Variable 2 (Factor B)
The second independent variable follows the same rules as the first. It must also be numeric, categorical, and properly labeled.
For example, gender may be coded as:
- 1 = Male
- 2 = Female
Ensure that:
- Value labels are entered correctly
- Measurement level is set to Nominal
- No missing codes are present unless defined properly
Incorrect or inconsistent coding between factors is a common reason why interaction effects fail to appear in SPSS output.
Step 6: Review Variable View Before Data Entry
Before moving to Data View, review all variable definitions carefully. This review step prevents downstream errors and saves time during analysis and interpretation.
Confirm that:
- All variables are numeric
- Labels accurately describe the variables
- Value labels match the study design
- Measurement levels are correct
Once this is verified, proceed to Data View.
Step 7: Enter Data in Data View Correctly
In Data View, each row corresponds to one participant. Each column corresponds to one variable defined earlier. Data must be entered consistently and without gaps.
Example Data Layout
| score | method | gender |
|---|---|---|
| 78 | 1 | 1 |
| 85 | 2 | 1 |
| 72 | 1 | 2 |
| 88 | 2 | 2 |
Entering data in this structure allows SPSS to correctly assign each participant to the appropriate combination of factor levels.
Step 8: Activate and Check Value Labels
After entering data, enable Value Labels from the toolbar or menu. This step allows SPSS to display category names instead of numeric codes, making it easier to visually inspect the dataset.
Review the dataset carefully to ensure:
- No category is miscoded
- No participant is assigned to an incorrect group
- No missing values are present unintentionally
Step 9: Preparing Data for Two-Way ANOVA Analysis
Once data entry is complete, the dataset is ready for analysis. Navigate to Analyze → General Linear Model → Univariate. SPSS will now correctly recognize the dependent variable and both factors.
If SPSS does not allow you to move variables into the appropriate boxes, this usually indicates an error in measurement level or variable type.
Common Data Entry Errors That Invalidate Two-Way ANOVA
Many incorrect ANOVA results stem from data entry mistakes rather than statistical misunderstanding. Common issues include using text instead of numeric codes, incorrectly labeling measurement levels, and mixing categorical and continuous coding styles.
Avoiding these errors ensures your analysis is accepted by instructors, supervisors, and examiners.
APA-Style Descriptive Statistics Example Table
| Teaching Method | Gender | Mean | SD | N |
|---|---|---|---|---|
| Online | Male | 74.2 | 6.1 | 20 |
| Online | Female | 71.8 | 5.9 | 22 |
| In-person | Male | 86.3 | 4.8 | 21 |
| In-person | Female | 88.1 | 5.2 | 23 |
Correct data entry enables SPSS to generate tables like this automatically.
Frequently Asked Questions
Can I enter factor names as text?
No. SPSS requires numeric coding for all categorical variables used in ANOVA.
Can I have more than two levels per factor?
Yes. Two-way ANOVA supports multiple levels as long as data is coded correctly.
Is balanced data required?
Balanced designs are preferred but not required. Correct coding is more important than equal group sizes.
Can I import data from Excel?
Yes, but Variable View must be reviewed and corrected after import.
Final Checklist Before Running Two-Way ANOVA
- One row per participant
- Numeric dependent variable set to Scale
- Two categorical factors set to Nominal
- Proper value labels applied
- No missing or miscoded values
Need Professional Help With Two-Way ANOVA in SPSS?
Struggling with two-way ANOVA data entry or SPSS output interpretation? Our SPSS Dissertation Help experts can review your dataset, correct errors, run the analysis, and deliver APA-formatted results.
Get a free quote today based on your requirements and submission deadline.
Correct data entry is the foundation of valid two-way ANOVA results. Once your dataset is structured properly, SPSS will produce accurate and defensible statistical output.