How to Interpret Confidence Intervals in SPSS
Confidence intervals are a core concept in statistics and one of the most powerful tools available in SPSS for understanding and interpreting results. While many students can generate confidence intervals with a few clicks, far fewer understand what those intervals actually mean or how to explain them correctly in assignments, dissertations, and research reports. Misinterpreting confidence intervals is one of the most common statistical errors made by students, particularly when confidence intervals are confused with probabilities or misused as simple substitutes for p-values.
This guide provides a clear and in-depth explanation of how to interpret confidence intervals in SPSS using simple but academically correct language. It explains what confidence intervals represent, how to interpret them across different statistical analyses, how they relate to statistical hypothesis testing, and how to report them correctly in academic writing. If you are new to the software, you may find our detailed guide on SPSS data analysis helpful, while students working with predictive models can explore our resources on regression analysis in SPSS. By the end of this guide, you will be able to interpret confidence intervals confidently and explain them clearly in your own work.
What a Confidence Interval Really Means
A confidence interval is a range of values that is calculated from sample data and is used to estimate an unknown population parameter, such as a mean, a difference between groups, a correlation coefficient, or a regression coefficient. In SPSS, confidence intervals are most commonly reported at the 95% level, although other levels such as 90% or 99% may also be used.
A 95% confidence interval does not mean that there is a 95% probability that the true population value lies within the interval. This is a common misconception. Instead, it means that if the same study were repeated many times using the same method, approximately 95% of the confidence intervals calculated from those samples would contain the true population value. The confidence level reflects the reliability of the method, not the probability of the parameter itself.
Why Confidence Intervals Matter More Than P-Values Alone
Confidence intervals provide more information than p-values because they show not only whether an effect exists, but also the size and precision of that effect. While a p-value simply tells you whether a result is statistically significant, a confidence interval tells you how large the effect might reasonably be and how much uncertainty surrounds that estimate.
In academic research, confidence intervals are especially valuable because they allow readers to assess practical significance, not just statistical significance. A statistically significant result with a very wide confidence interval may be less informative than a result with a narrow interval, even if both have similar p-values. For this reason, many universities, supervisors, and journals encourage or require confidence intervals to be reported alongside p-values.
Interpreting Confidence Intervals for the Mean in SPSS
When SPSS reports a confidence interval for a mean, the interval represents the range within which the true population mean is likely to fall. Interpretation should focus on both the location and the width of the interval. The center of the interval reflects the sample mean, while the width reflects the precision of the estimate.
A narrow confidence interval indicates that the mean has been estimated with relatively high precision, often due to a large sample size or low variability in the data. A wide confidence interval suggests greater uncertainty, which may result from a small sample size or high variability. When interpreting confidence intervals for means, it is important to describe the interval in words rather than simply listing the numbers, explaining what the range implies about the population.
Interpreting Confidence Intervals in T-Tests
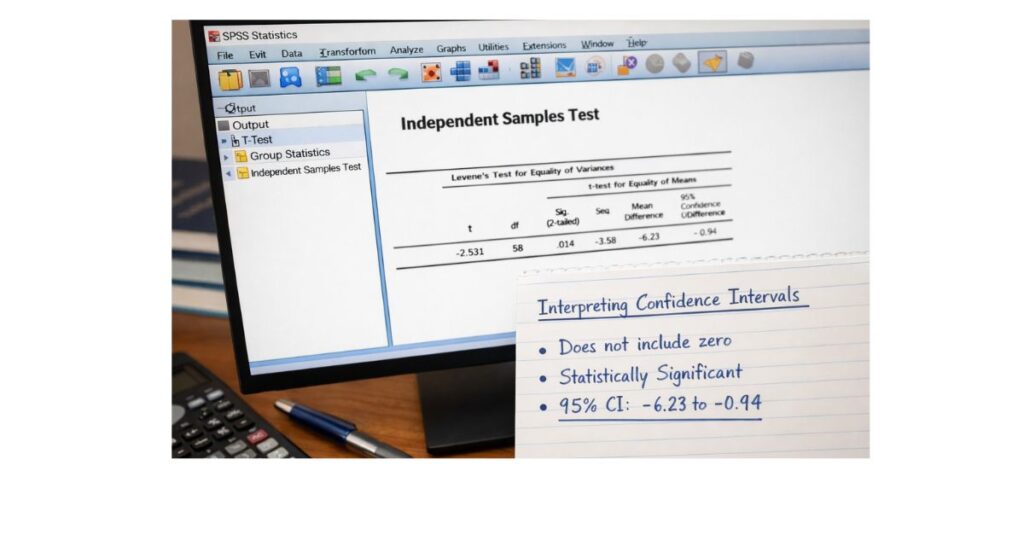
In t-tests, SPSS reports confidence intervals for the mean difference between two groups or between two measurements. These confidence intervals are particularly useful for determining statistical significance without relying solely on p-values.
The key rule for interpretation is straightforward. If the confidence interval for the mean difference includes zero, the result is not statistically significant. This is because a difference of zero is a plausible value within the range, meaning there may be no true difference between the groups. If the confidence interval does not include zero, the result is statistically significant, indicating that a true difference between groups is likely to exist.
Beyond significance, the confidence interval also shows the plausible size of the difference. A narrow interval suggests a more precise estimate of the group difference, while a wide interval indicates more uncertainty about how large the difference truly is.
Interpreting Confidence Intervals in ANOVA and Post-Hoc Tests
In ANOVA, confidence intervals usually appear in post-hoc pairwise comparisons between groups. Each confidence interval represents the estimated difference between two group means and the range within which the true difference is likely to lie.
Interpretation follows the same logic as in t-tests. If the confidence interval for a pairwise comparison includes zero, there is no statistically significant difference between those two groups. If the interval excludes zero, the difference is statistically significant. When writing results, it is important to clearly state which groups were compared and what the confidence interval indicates about their difference.
Interpreting Confidence Intervals in Correlation Analysis
When SPSS reports confidence intervals for correlation coefficients, the interval represents the range of plausible values for the true population correlation. Confidence intervals are especially useful here because they indicate not only whether a relationship exists, but also how strong that relationship might reasonably be.
If the confidence interval includes zero, the correlation is not statistically significant, suggesting that the true relationship may be weak or nonexistent. If the interval does not include zero, the correlation is statistically significant. The width of the interval reflects the precision of the estimate, with narrower intervals indicating greater confidence in the strength of the relationship.
Interpreting Confidence Intervals in Linear Regression
In linear regression, confidence intervals are reported for regression coefficients. These intervals show the range within which the true effect of a predictor on the outcome variable is likely to lie, holding other predictors constant.
The interpretation rule is again based on whether zero falls within the interval. If the confidence interval for a regression coefficient includes zero, the predictor is not statistically significant. If the interval excludes zero, the predictor significantly contributes to the model. Confidence intervals in regression are particularly important because they show both the direction and the possible magnitude of each predictor’s effect.
Confidence Intervals and Their Relationship to Hypothesis Testing
Confidence intervals and hypothesis tests are closely related. In most common analyses, a 95% confidence interval that excludes the null value (such as zero) corresponds to a p-value less than .05, while an interval that includes the null value corresponds to a p-value greater than .05. When results are interpreted correctly, confidence intervals and p-values should lead to the same conclusion about statistical significance.
However, confidence intervals provide additional insight by showing the range of plausible effect sizes, which p-values alone cannot do. For this reason, confidence intervals are often preferred for interpretation, especially in applied research.
Common Mistakes When Interpreting Confidence Intervals
Many students make similar mistakes when interpreting confidence intervals. One of the most common is treating the confidence interval as a probability statement about the parameter. Another frequent error is assuming that a wider interval indicates a stronger result, when in fact it usually indicates greater uncertainty. Some students also ignore confidence intervals entirely and rely only on p-values, missing valuable information about precision and effect size.
Avoiding these mistakes requires careful wording and a clear understanding of what confidence intervals represent.
How to Report Confidence Intervals in Academic Writing
When reporting confidence intervals in academic work, they should be presented clearly and integrated into the narrative. Rather than listing numbers without explanation, the interval should be described in context, explaining what it suggests about the population parameter. Confidence intervals are typically reported in parentheses using square brackets, following APA style guidelines.
Clear reporting helps readers understand both the statistical and practical implications of the results and strengthens the overall quality of the analysis.
Final Thoughts
Learning how to interpret confidence intervals in SPSS is a critical step in developing strong statistical reasoning skills. Confidence intervals move analysis beyond simple significance testing and allow researchers to think more carefully about precision, uncertainty, and real-world meaning. When interpreted and reported correctly, confidence intervals make your SPSS results clearer, more informative, and more academically sound.
If you can confidently explain what a confidence interval shows and what it does not show, you are already ahead of many students who rely solely on p-values without understanding their limitations.