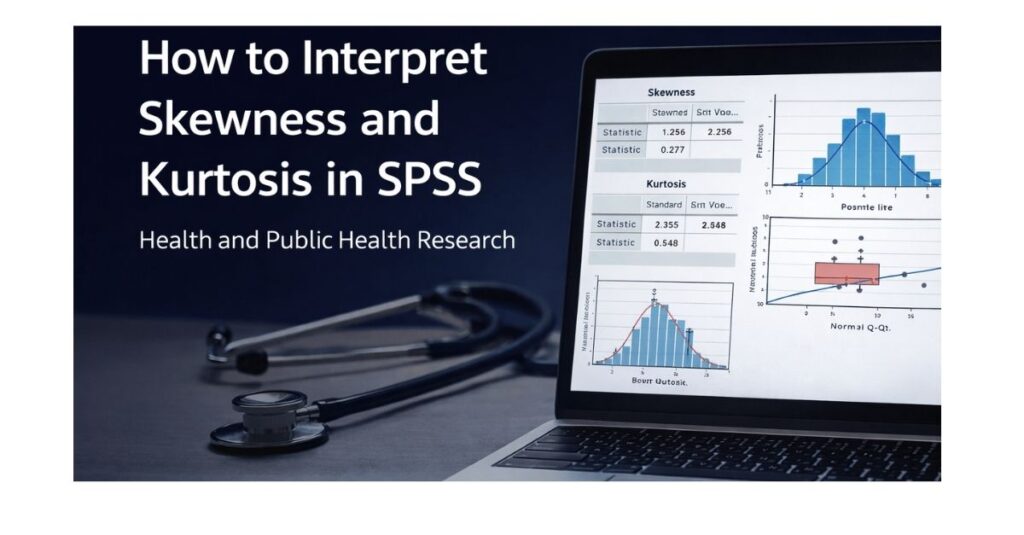
How to Interpret Skewness and Kurtosis in SPSS for Health and Public Health Research
In health, medical, and public health research, interpreting skewness and kurtosis correctly is not optional. These statistics are a core part of data screening, assumption testing, and methodological justification when analyzing health-related data using SPSS. Variables such as disease incidence, healthcare costs, hospital length of stay, biomarker levels, and survey-based health outcomes rarely follow perfectly normal distributions.
Supervisors, examiners, and journal reviewers expect researchers to evaluate distribution shape explicitly before selecting inferential tests. Misinterpreting skewness and kurtosis is one of the most common reasons health-science dissertations are flagged for revision.
This guide provides a health-focused, SPSS-based explanation of skewness and kurtosis, explaining how to interpret their values correctly, how they affect statistical decisions in health research, and how to report them clearly in academic writing.
If you require expert support with data screening or assumption testing, see our Dissertation Data Analysis Help and Statistical Analysis Help services on spssdissertationhelp.com.
Why Distribution Shape Matters in Health and Medical SPSS Analysis
In health research, distribution shape has direct implications for statistical validity and clinical interpretation. Many commonly used SPSS procedures in public health and medical studies rely on assumptions that, if violated, can compromise results.
Accuracy of Health Estimates
Highly skewed or heavy-tailed health variables can distort means, standard deviations, regression coefficients, and confidence intervals. For example, skewed hospitalization costs or biomarker values may produce misleading averages that do not reflect typical patient outcomes.
Validity of Inferential Tests
Non-normal distributions can inflate or suppress test statistics, increasing the risk of incorrect conclusions. This is particularly problematic in epidemiological studies with moderate sample sizes or subgroup analyses.
Interpretability of Health Findings
When assumptions are violated, statistically significant results may not represent meaningful health effects. Explicitly interpreting skewness and kurtosis demonstrates responsible statistical practice.
Methodological Transparency
Reporting skewness and kurtosis strengthens the methodology section and signals rigorous data screening, which is essential in public health, nursing, and clinical research.
What Is Skewness in Health Data?
Skewness measures the direction and degree of asymmetry in a distribution. In health research, skewness is common and expected for many variables.
Symmetric Health Variables
Variables such as standardized test scores or normally distributed physiological measures may approximate symmetry, with skewness close to zero.
Positive Skewness in Health Research
Positive skewness occurs when most values are low, with a long tail toward higher values. Common examples include:
- Disease incidence counts
- Healthcare expenditures
- Hospital length of stay
- Reaction time or symptom duration
In these cases, the mean is often higher than the median due to extreme values.
Negative Skewness in Health Research
Negative skewness occurs when most values are high, with a tail toward lower values. This pattern may appear in:
- Patient satisfaction scores
- Functional status scales
- Quality-of-life measures with ceiling effects
SPSS reports skewness numerically, allowing researchers to quantify both direction and magnitude.
What Is Kurtosis and Why It Matters in Health Studies?
Kurtosis reflects how concentrated values are in the center and tails of a distribution. SPSS reports excess kurtosis, where zero represents normality.
Mesokurtic Health Distributions
These resemble the normal curve and are ideal for parametric analysis.
Leptokurtic Health Distributions
Leptokurtic distributions show heavy tails and frequent extreme values. In health research, this often indicates:
- Outlier-driven clinical measures
- Rare but severe outcomes
- High-risk subpopulations
High kurtosis increases sensitivity to outliers and can destabilize regression models.
Platykurtic Health Distributions
Platykurtic distributions are flatter than normal, indicating evenly spread values and reduced central clustering.
Kurtosis is especially important in medical datasets where extreme cases can strongly influence conclusions.
Why Skewness and Kurtosis Are Essential in SPSS Health Research
Skewness and kurtosis are used to:
Evaluate Normality Assumptions
Parametric tests such as t-tests, ANOVA, and regression assume approximate normality. Skewness and kurtosis provide numerical evidence for this assessment.
Guide Statistical Test Selection
When distributions deviate substantially from normality, non-parametric tests or alternative models may be more appropriate. Reporting skewness and kurtosis justifies these decisions.
Justify Data Transformation
Transformations are often required in health research to stabilize variance and reduce skewness. These statistics provide the rationale for transformation.
Strengthen Academic Credibility
Explicit interpretation demonstrates statistical competence and adherence to best practices expected in health sciences.
For broader assumption testing guidance, see How to Test Assumptions of Linear Regression in SPSS on spssdissertationhelp.com.
Interpreting Skewness Values in SPSS
Direction
- Positive values indicate a longer right tail
- Negative values indicate a longer left tail
Magnitude Guidelines (Health Research Context)
- −1 to +1: Acceptable symmetry
- −2 to +2: Moderate skewness, often acceptable in large health samples
- Beyond ±2: Substantial skewness requiring caution
- Beyond ±3: Severe skewness likely violating parametric assumptions
Magnitude must always be considered alongside sample size and clinical relevance.
Interpreting Kurtosis Values in SPSS
Kurtosis indicates the influence of extreme observations:
- Low to moderate kurtosis suggests stable health distributions
- High kurtosis signals outlier-driven variables
- Very low kurtosis suggests overly uniform data
Kurtosis should always be interpreted together with skewness and visual diagnostics.
Using Z-Scores for Skewness and Kurtosis in SPSS
SPSS provides standard errors that allow significance testing:
- |z| ≤ 1.96 indicates no statistically significant deviation
- |z| > 1.96 indicates significant non-normality
Z-scores are particularly valuable in large public health datasets, where small deviations may still be meaningful.
Visual Diagnostics for Health Data in SPSS
Numerical indicators must be supported by graphs:
- Histograms with normal curves for symmetry and tails
- Boxplots for outliers and tail heaviness
- Normal Q–Q plots for theoretical normality comparison
Visual and numerical evidence together provide defensible conclusions.
Reporting Skewness and Kurtosis in Health Research Writing
Best practices include:
- Reporting both statistics together
- Describing direction and magnitude
- Linking interpretation to assumption testing
- Avoiding unexplained numerical listings
Example:
“Skewness (1.12) and kurtosis (2.03) indicated a moderately right-skewed distribution, supporting the use of non-parametric analysis.”
For reporting guidance, see How to Interpret SPSS Output on spssdissertationhelp.com.
Consequences of Ignoring Skewness and Kurtosis in Health Research
Failure to address distribution shape can result in:
- Invalid statistical conclusions
- Misleading clinical interpretations
- Rejected dissertations or manuscripts
- Requests for reanalysis
- Reduced credibility of findings
Final Takeaway
In health and public health research, skewness and kurtosis are essential diagnostic statistics, not optional outputs. Correct interpretation informs test selection, supports methodological decisions, and protects the validity of inferential conclusions.
A strong understanding of how to interpret skewness and kurtosis in SPSS is therefore critical for producing high-quality, examiner-approved health research.
If you need expert assistance with data screening, assumption testing, or interpretation, explore SPSS Dissertation Help, Dissertation Data Analysis Help, and Statistical Analysis Help on spssdissertationhelp.com.