
One way ANOVA is one of the most important statistical tests students encounter in SPSS. It is commonly required in psychology, education, nursing, business, public health, and social science courses. Yet many students struggle not because the test is difficult, but because SPSS output is confusing and instructors expect correct interpretation and APA-style reporting, not just numbers.
This guide explains how to perform one-way ANOVA in SPSS from start to finish, using clear explanations, real academic examples, and student-friendly language. By the end, you will understand when to use one-way ANOVA, how to run it correctly, how to interpret every table, and how to write results properly.
What is One-Way ANOVA
One-way ANOVA, also known as one-factor ANOVA, is used when you want to compare the average scores of three or more independent groups on a single continuous outcome variable.
Instead of running multiple t-tests (which increases error), one-way ANOVA tests all group differences at the same time while controlling statistical error.
Example Research Questions
- Do stress levels differ across three job roles?
- Are exam scores different across teaching methods?
- Does job satisfaction vary by income group?
If your independent variable has three or more categories and your dependent variable is numeric, one way ANOVA is usually the correct test.
When You Should Use One-Way ANOVA in SPSS
You should use one-way ANOVA when all of the following are true:
- Your dependent variable is continuous (score, income, scale total)
- Your independent variable has three or more groups
- Each participant belongs to only one group
- Data is approximately normally distributed
- Variances are reasonably equal
If these assumptions are violated, SPSS offers alternatives, but one-way ANOVA is the default choice in most academic projects.
Step 1: Prepare Your Data Correctly in SPSS
Before running any analysis, your dataset must be structured properly.
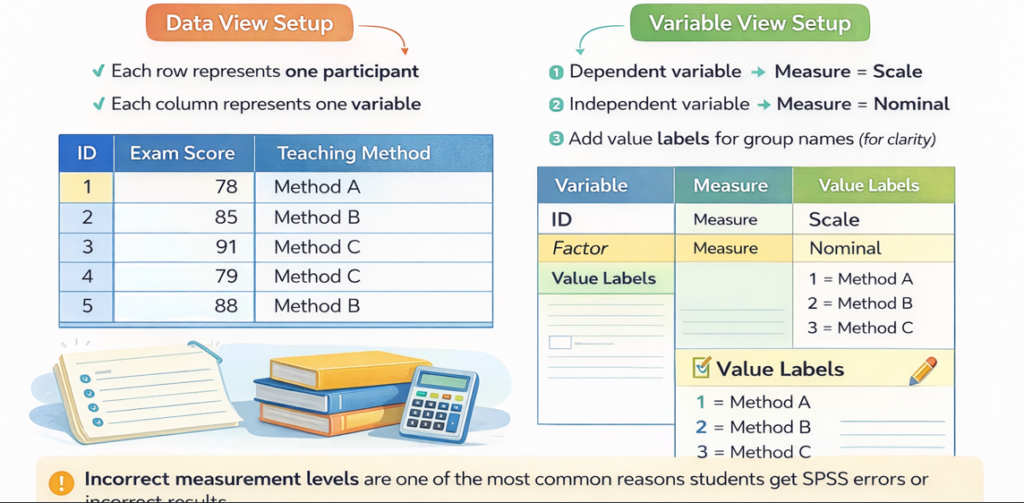
Data View Setup
- Each row represents one participant
- Each column represents one variable
Variable View Setup
- Dependent variable → Measure = Scale
- Independent variable → Measure = Nominal
- Add value labels for group names (for clarity)
Incorrect measurement levels are one of the most common reasons students get SPSS errors or incorrect results.
Step 2: Open One Way ANOVA in SPSS
Follow these exact steps:
- Click Analyze
- Select Compare Means
- Click One Way ANOVA
- Move your dependent variable into Dependent List
- Move your grouping variable into Factor
- Click Options
- Check Descriptive
- Check Homogeneity of variance test
- Click Continue
- Click OK
SPSS will now generate multiple output tables.
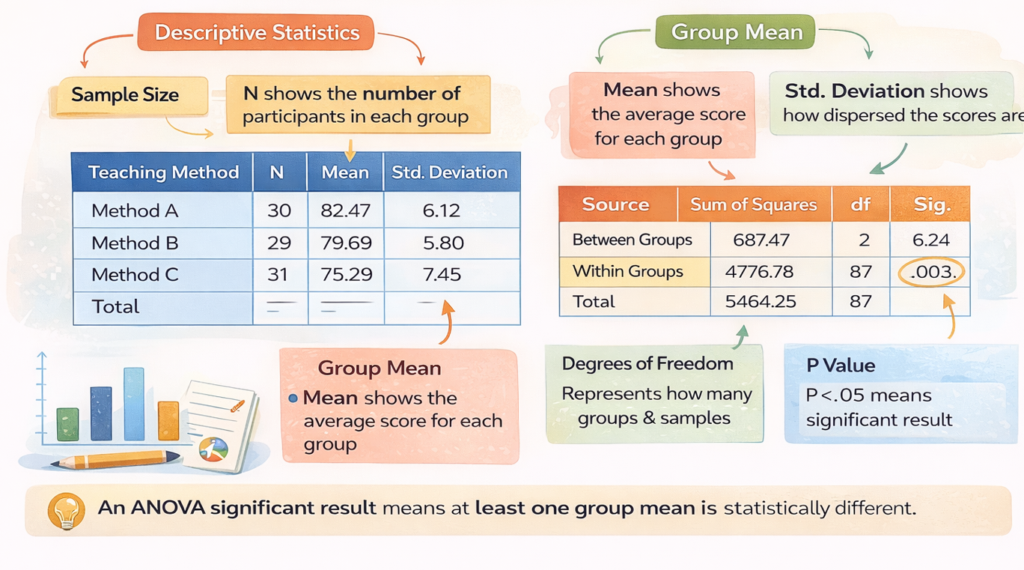
Step 3: Understand Descriptive Statistics Output
Step 4: Check Levene’s Test (Homogeneity of Variance)
Levene’s Test checks whether group variances are similar.
- p > .05 → assumption met
- p < .05 → assumption violated
This result determines which post hoc test you should use later.
Step 5: Interpret the ANOVA Table
Key values to interpret:
- F statistic
- Degrees of freedom
- Significance (Sig.)
Example
F(2, 87) = 6.24, p = .003
This means:
- There is a statistically significant difference between at least one group mean
- The null hypothesis is rejected
ANOVA does not tell you which groups differ — that is why post hoc tests are required.
Step 6: Run Post Hoc Tests Correctly
Post hoc tests identify exact group differences.
Which Post Hoc Test to Use
- Levene’s p > .05 → Tukey
- Levene’s p < .05 → Games Howell
How to Run
- Click Post Hoc in the ANOVA dialog
- Select appropriate test
- Click Continue
- Click OK
Step 7: Interpret Post Hoc Results
Post hoc tables show:
- Mean differences
- Significance values
- Confidence intervals
Example Interpretation
Students taught with Method A scored significantly higher than those taught with Method C (p < .01), while no significant difference was found between Methods A and B.
Step 8: Write One Way ANOVA Results in APA Format
Correct APA Example
A one way ANOVA revealed a significant difference in exam scores across teaching methods, F(2, 87) = 6.24, p = .003. Post hoc Tukey tests showed that Method A produced significantly higher scores than Method C.
APA accuracy is critical for grading and dissertation approval.
Common One Way ANOVA Mistakes Students Make
- Using ANOVA for two groups instead of t test
- Ignoring Levene’s test
- Forgetting post hoc analysis
- Reporting p = 0.000 instead of p < .001
- Not linking results to research questions
Avoiding these mistakes immediately improves academic quality.
When One Way ANOVA Is NOT Appropriate
Do not use one way ANOVA if:
- You have only two groups
- Your outcome variable is categorical
- Groups are repeated measures
- Data is extremely non normal
Choosing the wrong test can invalidate your results.
Frequently Asked Questions
Can I use one way ANOVA for Likert scales?
Yes, if the scale is treated as continuous and assumptions are met.
Do I need post hoc tests if ANOVA is not significant?
No, post hoc tests are only required after a significant ANOVA.
What if Levene’s test is significant?
Use Games Howell instead of Tukey.
Get Expert Help With One-Way ANOVA in SPSS
If SPSS output feels overwhelming or your assignment requires perfect accuracy, we help with:
- SPSS Help for Students
- SPSS Homework Help
- SPSS Output Interpretation
- Dissertation Data Analysis Help
We deliver accurate analysis, clear explanations, and APA-ready results