Survival analysis in SPSS is essential for research that focuses on time-to-event outcomes. In many studies, the key question is not just whether an event occurred, but when it occurred. This is common in healthcare, public health, and business research, where scholars may study survival after treatment, time to relapse, or customer churn. Standard statistical methods are often not suitable because they do not handle censored observations well or capture timing as effectively as survival methods.
Many researchers look for guidance on how to perform survival analysis in SPSS when working on a dissertation, thesis, journal article, or report. They may be unsure how to define the time variable, code the event indicator, interpret survival curves, or report results clearly.
Survival analysis is valuable because it allows researchers to use incomplete follow-up data instead of discarding participants who did not experience the event during the study period. This guide explains what survival analysis is, when to use it, how to prepare data, run Kaplan-Meier analysis in SPSS, and interpret the output correctly.
What survival analysis means in research
Survival analysis is a family of statistical methods used to examine the time until a specific event occurs. The event can be death, relapse, recovery, equipment failure, job termination, customer cancellation, graduation, or any clearly defined endpoint. The method is called survival analysis because it began in medical research, but its use now extends well beyond healthcare.
What makes survival analysis different from many other methods is that it focuses on two dimensions at the same time. It considers whether the event occurred and how long it took to occur. This is why it is often called time-to-event analysis. In standard methods such as linear regression or a simple comparison of means, researchers may lose valuable information about timing. In contrast, survival analysis allows timing to remain central to the study design.
Another major strength of survival analysis is its ability to handle censored cases. Censoring occurs when the event of interest has not occurred for a participant during the study period, or when the participant leaves the study before the event is observed. Instead of deleting these cases, survival analysis uses the information that is available up to the point of censoring. This is one of the reasons survival methods are widely regarded as more appropriate than simpler methods for longitudinal event-based data.
When researchers search for time to event analysis help, they are usually trying to solve one of several practical problems. They may want to compare survival times across two or more groups, estimate the probability of survival over time, identify factors associated with hazard, or present results that account for incomplete follow-up. SPSS includes tools for these needs, especially through Kaplan-Meier analysis and Cox regression.
When to use survival analysis in SPSS
Use survival analysis in SPSS when your study includes three main elements: a clearly defined event, a measurable time variable, and the possibility that some participants will not experience the event during the study period. When these conditions are present, survival analysis is usually more appropriate than ordinary regression or standard group comparisons.
Across healthcare research, this method is used to examine time from diagnosis to death, treatment to relapse, or hospital readmission. In nursing and public health, it helps researchers evaluate recovery time, infection-free survival, and time to complications. Psychology researchers may apply it to measure time to dropout or symptom recurrence.
Outside health sciences, survival analysis is also useful in business, engineering, and education. It can examine customer churn, machine failure, time to repeat purchase, graduation, or withdrawal.
SPSS is a practical option because it offers a user-friendly way to create survival curves and compare groups without advanced programming. If your focus is on when an event happens, not just whether it happens, survival analysis is often the right choice.
Core concepts you need to understand before running the test
Before you perform survival analysis in SPSS, it is essential to understand the basic language of the method. This prevents errors later when you define variables or interpret output.
Survival time
Survival time is the length of time from a defined starting point to the occurrence of the event. The starting point must be clearly stated. For example, it may be the date of surgery, enrollment in the study, start of treatment, or purchase date in a customer study. The endpoint must also be clearly defined. Survival time is often recorded in days, weeks, months, or years.
Event
The event is the outcome whose occurrence is being studied. In medical research, that may be death or relapse. In a retention study, it may be dropout or churn. The event must be coded consistently and unambiguously for all participants.
Censoring
Censoring happens when a participant’s full event time is unknown. This may occur because the participant did not experience the event before the study ended, was lost to follow-up, or withdrew from the study. Censored cases are not failures of the study. They are expected in survival research and must be coded correctly for SPSS to analyze them properly.
Survival function
The survival function estimates the probability that a participant survives beyond a given time point. It is often displayed as a survival curve. This function helps researchers understand how survival probability changes over time.
Hazard
Hazard is the likelihood that the event occurs at a specific time among individuals who have remained event-free up to that point. This concept is especially important in Cox regression, where researchers assess how predictors influence the probability of experiencing the event.
Median survival time
Median survival time is the point at which half of the study population has experienced the event. It is often more informative than the mean when survival times are skewed or censored.
Researchers who understand these concepts early tend to make better decisions about coding, analysis, and reporting. They also produce clearer interpretations in thesis chapters and journal manuscripts.
Types of survival analysis available in SPSS
SPSS offers more than one way to analyze survival data. The correct procedure depends on the purpose of your study.
Life tables
Life tables divide follow-up time into intervals and estimate survival probabilities across those intervals. This method can be useful in large studies with grouped time data, but many dissertation-level projects now rely more heavily on Kaplan-Meier analysis because it uses exact event times more efficiently.
Kaplan-Meier survival analysis
Kaplan-Meier analysis is one of the most widely used methods in SPSS for estimating survival probabilities over time. It creates a survival curve and allows researchers to compare groups using tests such as the log-rank test. When students ask about Kaplan Meier survival analysis in SPSS, this is usually the first procedure they need.
Cox regression
Cox proportional hazards regression is used when the goal is not only to estimate survival but also to examine how multiple predictors influence the hazard of the event. This is especially useful when a researcher needs to control for age, treatment type, gender, severity score, income, or other covariates.
For many beginners, the best path is to start with Kaplan-Meier analysis and then move to Cox regression if the study requires explanatory modeling. Our Cox regression analysis help service is especially useful for researchers who need help checking assumptions, interpreting hazard ratios, and writing results chapters.
How to prepare data for survival analysis in SPSS
Good survival analysis begins with good data preparation. Even the most advanced statistical method will produce misleading results if the time and status variables are coded incorrectly.
In SPSS, the minimum structure usually includes one variable for survival time and one variable for event status. You may also have grouping variables or predictors depending on the analysis.
1. Create the time variable
The time variable shows how long each participant was followed until the event or censoring. This variable should be numeric. Researchers often use days, weeks, months, or years depending on the design of the study. What matters most is consistency. Do not mix units unless you convert them first.
For example:
| Participant | Time_Months | Event_Status |
|---|---|---|
| 1 | 10 | 1 |
| 2 | 15 | 0 |
| 3 | 7 | 1 |
| 4 | 12 | 0 |
In this simple example, the number in the time column represents the follow-up duration. The event status column indicates whether the event occurred.
2. Code the event variable
The event variable must distinguish between cases that experienced the event and those that were censored. A common coding approach is:
- 1 = event occurred
- 0 = censored
You must check which value SPSS is told to treat as the event. A frequent mistake is reversing the coding. If you make this error, the entire survival interpretation becomes incorrect.
3. Prepare the group variable if comparing groups
If you want to compare groups, such as males versus females or treatment group versus control group, create a categorical grouping variable. This is what SPSS will use to produce separate survival curves and test whether survival differs significantly across categories.
4. Screen the data carefully
Before running the analysis, inspect the dataset for:
- missing time values
- impossible follow-up durations
- incorrect event coding
- inconsistent group labels
- duplicate cases
- outliers caused by entry errors
Researchers often focus on the analysis menu and forget that data structure determines whether the results are meaningful. A clean dataset saves time later when you begin writing interpretation.
How to perform Kaplan-Meier survival analysis in SPSS
Kaplan-Meier analysis is often the first survival method researchers use because it is visual, intuitive, and highly relevant to group comparisons. It estimates survival probabilities based on observed event times and accommodates censoring effectively.
Below is a practical step-by-step approach for running Kaplan-Meier in SPSS.
Step 1: Open your dataset
Load the data file into SPSS and confirm that the time variable, event variable, and any group variable are properly coded.
Step 2: Go to the survival analysis menu
In SPSS, select:
Analyze > Survival > Kaplan-Meier
This opens the dialog box where you specify the variables for the procedure.
Step 3: Assign the time variable
Move your survival time variable into the Time box. This tells SPSS which variable contains the duration from baseline to event or censoring.
Step 4: Assign the status variable
Move your event indicator into the Status box. Then click Define Event and specify the value that represents the event occurring, such as 1.
This step is critical. If the wrong event value is entered, the output will not match your research question.
Step 5: Add a factor variable if needed
If you are comparing two or more groups, place your categorical group variable into the Factor box. SPSS will then produce survival curves for each category and test for group differences.
Step 6: Choose options
Select the appropriate options based on your study needs. Many researchers request:
- survival table
- means and medians
- plots
- censored cases on the curve
For group comparisons, make sure you request the log-rank test. This test evaluates whether the survival experience differs significantly across groups.
Step 7: Run the analysis
Click OK and review the output. SPSS will generate tables and a survival plot that summarize the pattern of event occurrence over time.
For many dissertation projects, this stage is where confusion begins. Students see curves, medians, and significance values but do not know how to explain them academically. That is where SPSS dissertation help becomes valuable, especially when the goal is not only to run the test but also to defend the result in a supervisor meeting or viva.
How to read the Kaplan-Meier output in SPSS
SPSS Kaplan-Meier output usually includes several parts. Each output section contributes something different to the interpretation.
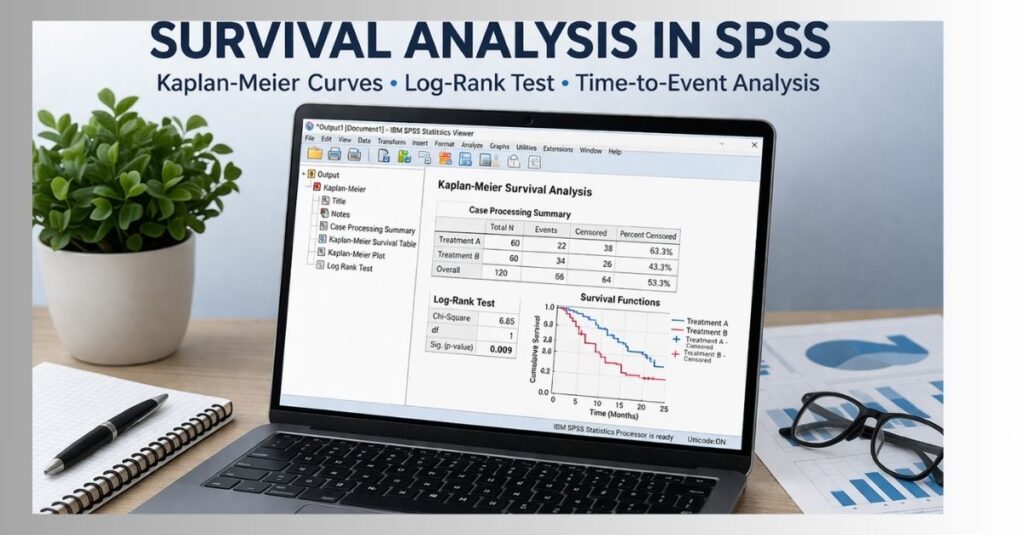
Case processing summary
This table tells you how many cases were included, how many events occurred, and how many were censored. Review this section first because it confirms that SPSS interpreted your coding correctly.
For example, if you expected 80 events but SPSS reports only 12, you should immediately check the event coding and missing data.
Survival table
The survival table provides the number at risk, number of events, and cumulative survival probabilities across time points. This helps you understand the pattern of survival decline over time.
Means and medians for survival time
SPSS may report the mean and median survival times. Median survival is often more useful in survival analysis because it is less sensitive to skewed distributions and censoring. Researchers commonly report the median survival time when discussing when half of the participants experienced the event.
Survival plot
The survival curve is one of the most interpretable parts of the output. It shows the probability of remaining event-free as time progresses. Each downward step indicates an event. Tick marks usually indicate censored cases.
If multiple groups are included, the graph shows whether one group appears to survive longer than another. A curve that stays higher over time indicates greater survival probability.
Log-rank test
The log-rank test compares survival distributions across groups. If the p-value is below the chosen significance level, the study provides evidence that survival differs significantly between the groups.
However, significance alone is not enough. Strong academic reporting also explains the direction of the difference, the shape of the curves, and the practical meaning of the finding.
Request a Quote Now if you need help converting SPSS survival output into dissertation-ready interpretation, APA tables, and polished results writing for your research project.
Common mistakes researchers make in survival analysis
Many weak survival analyses are not caused by bad software. They are caused by avoidable researcher errors. Knowing these mistakes can protect the quality of your study.
One common error is using the wrong event coding. If you accidentally code censoring as the event, the entire analysis becomes inverted. Another frequent issue is defining an unclear starting point. Survival time must always begin from a specific and consistent baseline. Researchers also make mistakes by mixing time units, failing to screen missing values, or comparing groups without enough cases to support meaningful conclusions.
Another problem occurs when students run Kaplan-Meier analysis even though their research question really requires Cox regression. Kaplan-Meier is excellent for descriptive survival estimation and group comparison, but it cannot simultaneously adjust for multiple covariates the way Cox regression can.
Finally, many researchers misreport survival results in writing. They may state that one group survived better than another without referencing the log-rank test, the median survival time, or the actual pattern shown on the curve. Strong results writing must connect the table, graph, and significance test into one coherent interpretation.
How to interpret survival analysis results in dissertation language
Running survival analysis in SPSS is only one part of the process. The real academic value comes from explaining the results clearly, accurately, and in a way that matches your research objectives. Many students can produce the output, but they struggle when writing Chapter Four, a journal results section, or a supervisor-ready interpretation. The best approach is to move from the broad finding to the specific statistical evidence.
Start by stating what the analysis examined. For example, explain that a Kaplan-Meier survival analysis was conducted to estimate the probability of remaining event-free over time and to compare survival distributions between groups. This opening sentence tells the reader what method you used and why it was appropriate.
Next, summarize the overall survival pattern. If the survival curve declines steeply early in the study, say so. If one group remains higher on the curve across most time points, explain that this group showed better survival probability or longer time to event. Then support that observation with the log-rank test and median survival results where available. The interpretation should connect the graph, table, and significance test instead of discussing them separately.
A strong academic paragraph often sounds like this in structure: the method used, the groups compared, the general trend shown by the survival curves, the significance test result, and the substantive meaning of the difference. This style reads more professionally than simply copying p-values or describing the graph in vague terms.
Example of Kaplan-Meier interpretation
Suppose a researcher compares relapse-free survival between patients receiving Treatment A and Treatment B. SPSS shows that the Treatment A curve remains above the Treatment B curve for most of the study period, and the log-rank test is statistically significant. A concise interpretation could look like this:
A Kaplan-Meier survival analysis was conducted to compare relapse-free survival between patients receiving Treatment A and those receiving Treatment B. The survival curves indicated that patients in Treatment A maintained a higher probability of remaining relapse-free across the follow-up period. The log-rank test showed a statistically significant difference in survival distributions between the two groups, suggesting that relapse occurred earlier and more frequently among patients in Treatment B. The median relapse-free survival time was longer for Treatment A, which further supports the conclusion that Treatment A was associated with improved survival outcomes during the study period.
This type of paragraph works because it interprets the finding rather than merely listing output. It also stays close to the research question. In dissertations and theses, your interpretation should always bring the statistical result back to the study objective, hypothesis, or research question.
How to report survival analysis in APA style
Researchers should never paste raw SPSS output directly into a dissertation or journal manuscript. Instead, they should convert the results into polished tables, well-labeled figures, and narrative interpretation. APA style emphasizes clarity, brevity, and correct statistical presentation.
When reporting Kaplan-Meier findings, include the name of the method, the groups compared, the test used for group comparison, the relevant test statistic where appropriate, the p-value, and any important descriptive survival estimate such as median survival time. If a figure is included, label it clearly as a survival curve and ensure the axes are understandable to the reader.
Here is a general APA-style structure for a results sentence:
A Kaplan-Meier survival analysis indicated differences in time to event across the study groups. The log-rank test showed that the survival distributions differed significantly, p < .05. Participants in the intervention group demonstrated a longer median survival time than those in the comparison group.
If your institution requires exact p-values, use them unless the value is smaller than the reporting threshold specified by the style guide. Also make sure the figure title, table title, and narrative language remain consistent. If your table refers to relapse-free survival, do not switch to calling it event-free survival elsewhere unless both terms have been defined clearly.
Many students need help at this stage because they understand the analysis conceptually but are not sure how to turn it into clean academic writing. Our SPSS dissertation help and dissertation data analysis help are especially useful for transforming technical output into publication-style reporting.
Sample APA-style table for survival analysis results
| Group | Number of Cases | Events Observed | Censored Cases | Median Survival Time |
|---|---|---|---|---|
| Treatment A | 60 | 22 | 38 | 18.4 months |
| Treatment B | 60 | 34 | 26 | 12.1 months |
In the text, you would not just repeat every value. Instead, you would highlight what matters most. For example, you might say that the treatment group had fewer observed events and a longer median survival time than the comparison group, which aligned with the pattern shown by the Kaplan-Meier curve.
When to use Cox regression after Kaplan-Meier analysis
Kaplan-Meier analysis is excellent for estimating survival and comparing groups, but it has limits. It works best when the goal is descriptive comparison based on one grouping factor at a time. If your study asks whether multiple predictors affect time to event simultaneously, Cox regression is usually the stronger method.
Cox proportional hazards regression allows you to examine the relationship between survival time and several independent variables at once. This means you can estimate the effect of treatment while also adjusting for age, sex, baseline severity, income, comorbidity, or any other relevant covariates. In dissertation research, this is often essential because real-world outcomes are rarely explained by a single factor.
For example, imagine that a Kaplan-Meier analysis shows a difference in survival between two treatment groups. That is useful, but you may still want to know whether the difference remains after controlling for patient age and disease stage. Cox regression answers that question. It provides hazard ratios that show whether a variable increases or decreases the risk of the event occurring at any given time.
A practical workflow for many studies is this: begin with descriptive survival analysis using Kaplan-Meier curves, then follow with Cox regression if the research design includes multiple predictors. This combination gives both visual clarity and deeper explanatory power.
How to interpret hazard ratios in Cox regression
Hazard ratios are central to Cox regression. They tell you how the hazard of the event changes for one group relative to another or for a one-unit increase in a predictor. A hazard ratio above 1 suggests higher hazard, meaning the event is more likely to occur sooner. A hazard ratio below 1 suggests lower hazard, meaning the event is less likely to occur at any given time.
Suppose the hazard ratio for smokers relative to non-smokers is 1.80. This means smokers have an estimated 80 percent higher hazard of experiencing the event, assuming other variables in the model are held constant. If the hazard ratio for a treatment variable is 0.65, that suggests the treatment is associated with a 35 percent reduction in hazard.
Interpretation should always be grounded in the study context. The hazard ratio is not just a number. It represents a meaningful change in risk over time. Researchers should also consider the confidence interval. If the interval crosses 1, the effect may not be statistically reliable.
Many students confuse odds ratios with hazard ratios, especially when moving between logistic regression and survival analysis. That is why careful method selection and interpretation matter so much. Our Cox regression analysis help service can support variable selection, model interpretation, and dissertation-ready explanation of hazard ratios and confidence intervals.
Assumptions to check in survival analysis
Like every statistical method, survival analysis depends on assumptions. Researchers do not always need to discuss every technical detail at great length, but they should understand the assumptions well enough to justify the method and respond to questions from supervisors or reviewers.
Independent observations
The survival times of participants should generally be independent. If the data involve repeated events, clustered participants, or matched cases, then a more specialized modeling strategy may be required.
Correct event coding
The event indicator must be coded correctly and consistently. Survival methods rely heavily on distinguishing between observed events and censored observations. A simple coding error can reverse the meaning of the results.
Clear origin of time
The starting point for measuring survival time must be defined in the same way for all cases. Researchers weaken their studies when they mix baseline definitions or fail to explain when follow-up begins.
Non-informative censoring
A key assumption is that censoring is not strongly related to the likelihood of the event in a way the model cannot account for. In simple terms, cases that are censored should not systematically differ from those remaining under observation in a way that distorts the survival estimate.
Proportional hazards for Cox regression
If you use Cox regression, the proportional hazards assumption becomes especially important. This assumption means that the relative hazard between groups remains fairly constant over time. If this assumption is violated, the model may need modification or an alternative method.
Many dissertations mention assumptions only briefly, but even a short explanation adds credibility. It shows that the researcher chose the method thoughtfully rather than mechanically.
Common reporting weaknesses that hurt dissertation quality
Even when the statistical analysis is correct, poor presentation can make the work look weak. One common issue is describing the Kaplan-Meier curve without reporting whether the difference between groups was statistically significant. Another is presenting a significant log-rank test without explaining which group had better survival or how the curves differed over time.
Some students also overinterpret results. A significant survival difference does not automatically prove causation. If the study is observational, the interpretation must remain cautious. Likewise, if sample sizes are small or the number of events is limited, this should be acknowledged in the discussion.
Another weakness is mixing method names. A paper may say survival analysis in one paragraph, life table analysis in another, and Cox regression in a third without explaining how each was used. Readers should never have to guess what procedure produced which finding. Clear method labels help the entire results section feel more professional.
Researchers also sometimes ignore censoring in their written discussion. Because censoring is one of the defining reasons for using survival analysis, it should not disappear from the interpretation. A short explanation that the method accounted for censored observations strengthens the credibility of the results.
Request a Quote Now if you want help checking assumptions, organizing SPSS output, and writing a survival analysis results chapter that is clear, accurate, and supervisor-ready.
Practical tips to make your survival analysis blog or dissertation stronger
A strong survival analysis project does more than run the test correctly. It also makes the reasoning visible. Start by defining the event and follow-up time with precision. A reader should know exactly what counted as the event and exactly how the time variable was measured.
Next, align the analysis with the study objective. If the purpose is to compare groups, Kaplan-Meier may be sufficient. If the purpose is to assess multiple predictors of time to event, Cox regression is usually more appropriate. Then make sure your tables, curves, and written interpretation all use the same terminology.
Another useful strategy is to present both the statistical and practical meaning of the result. For example, rather than saying only that a survival difference was significant, explain what that means in plain language. For example, one treatment may have delayed relapse, one customer segment may have remained subscribed longer, or one intervention may have reduced the rate of failure. These details make the analysis relevant rather than purely technical.
Finally, remember that presentation matters. A clean survival curve, a well-structured APA table, and a concise narrative paragraph often make a stronger impression than pages of raw output. Dissertation committees and journal reviewers want interpretation, not screenshots of software results.
Why researchers seek professional survival analysis help
Survival analysis can become difficult quickly, especially when the research design includes multiple groups, covariates, censoring issues, missing data, or uncertain assumptions. Many researchers begin with confidence but become stuck when they see unfamiliar output or when they have to explain the meaning of survival probability and hazard in academic language.
Professional support becomes especially valuable in four situations. The first is when the student is unsure whether survival analysis is the correct method at all. The second is when the data need restructuring before SPSS can analyze them properly. The third is when the output has been generated but the interpretation is unclear. The fourth is when the dissertation chapter needs polished writing, APA tables, and methodological coherence.
At spssdissertationhelp.com, we help researchers with data analysis help, Kaplan Meier analysis help, Cox regression analysis help, and broader thesis data analysis help. The goal is not just to produce output, but to ensure the analysis fits the research question, the assumptions are addressed, and the final write-up is academically defensible.
Frequently asked questions about survival analysis in SPSS
What is survival analysis in SPSS used for?
Survival analysis in SPSS is used to study the time until a defined event occurs. It is especially useful when some participants do not experience the event during the study period, because the method can handle censored observations instead of discarding them.
What is the difference between Kaplan-Meier and Cox regression in SPSS?
Kaplan-Meier analysis estimates survival over time and compares survival curves across groups. Cox regression goes further by examining how one or more predictors influence the hazard of the event while adjusting for other variables in the model.
Can I use survival analysis outside medical research?
Yes. Although survival analysis began in healthcare, it is widely used in business, engineering, education, psychology, public health, and social sciences. Any study that examines time to an event can potentially use survival methods.
What does censoring mean in survival analysis?
Censoring means that the exact event time is not observed for a participant. This may happen because the study ends before the event occurs, the participant withdraws, or the participant is lost to follow-up. Survival analysis uses the available information up to the censoring time.
What does a higher survival curve mean?
A higher survival curve means a greater probability of remaining event-free over time. If one group’s survival curve remains above another group’s curve, that group generally demonstrates better survival experience during the observation period.
What is the log-rank test in SPSS?
The log-rank test is used in Kaplan-Meier analysis to compare survival distributions across groups. It evaluates whether the observed differences in the survival curves are statistically significant.
How do I code the event variable in SPSS survival analysis?
A common approach is to code 1 for event occurred and 0 for censored. However, what matters most is consistency and correctly defining the event value in SPSS before running the analysis.
Can survival analysis be used for dissertation research?
Yes. Survival analysis is widely used in dissertations, theses, and academic papers when the research question involves time to an event. It is particularly common in healthcare, nursing, epidemiology, public health, and applied social science research.
Is median survival time better than mean survival time?
In many survival studies, median survival time is more informative because it is less affected by skewness and censoring. Researchers often report median survival time when discussing when half the sample has experienced the event.
Can SPSS produce survival curves automatically?
Yes. SPSS can generate Kaplan-Meier survival curves directly from the survival analysis menu. These curves can then be formatted and interpreted for inclusion in a dissertation or research report.
Final thoughts
Learning how to perform survival analysis in SPSS gives researchers a practical way to study time-to-event outcomes with more accuracy than many simpler statistical methods. When the research question focuses on how long it takes for an event to occur, survival analysis becomes one of the most useful tools available. It helps researchers estimate survival probabilities, compare groups, handle censoring properly, and build more meaningful explanations around patterns of risk over time.
For many students and researchers, the challenge is not just clicking through the SPSS menu. The real challenge is preparing the data correctly, choosing the right survival method, interpreting the output in plain English, and presenting the findings in a scholarly format that fits dissertation or publication standards. That is why a strong survival analysis project combines sound statistics with careful writing and presentation.
If you are working on a thesis, dissertation, journal article, or institutional report and need support with time-to-event analysis, survival analysis help, SPSS dissertation help, and thesis data analysis help can make the process much easier and more accurate.
Request a Quote Now for expert support with survival analysis in SPSS, Kaplan-Meier curves, Cox regression, APA tables, interpretation, and dissertation results writing.