
Regression analysis is one of the most important statistical techniques used in university assignments, research papers, and dissertations. Whether you are studying psychology, business, nursing, public health, education, or social sciences, you will eventually need to run a regression in SPSS.
The challenge is that SPSS generates long tables filled with statistical terms such as coefficients, significance levels, F values, confidence intervals, and R squared values. Without proper guidance, interpreting these outputs becomes stressful and confusing for many students.
This guide provides a clear beginner friendly explanation of how to run a regression in SPSS, check assumptions, interpret your output, and write your results in proper APA style.
If you need personalized help with SPSS assignments, SPSS homework, or dissertation results, explore these support pages within our site:
SPSS home help
SPSS Help for Students
SPSS Dissertation Help
SPSS help online
What Is Regression in SPSS
Regression is used to predict or explain how one variable influences another.
- Dependent variable: The variable you want to predict. Examples include stress score, GPA, income, exam performance.
- Independent variables: The variables that are used to predict the dependent variable. Examples include hours worked, study time, sleep hours, or age.
Regression answers important academic questions such as:
- Does X significantly predict Y
- How much of Y can be explained by X
- Is the relationship positive or negative
- Which predictors are the strongest
Types of Regression Students Commonly Use
- Simple linear regression: One predictor and one outcome.
- Multiple linear regression: Two or more predictors and one outcome.
- Standard regression Enter method: All predictors entered into the model at once. This is the method required in most assignments and dissertations.
Step 1 Prepare Your Dataset
Before running regression, make sure your dataset meets the basic requirements.
- Dependent variable: Must be continuous.
- Predictors must be coded correctly: Numeric values for categorical variables and continuous values for numerical predictors.
- No missing values: Missing data causes SPSS to remove cases which produces incorrect results. See our guide on How to Replace Missing Values in SPSS.
Example dataset
- Stress Score dependent variable
- Work Hours independent variable
- Sleep Hours independent variable
Step 2 Check Regression Assumptions
Regression results are only valid if the assumptions are met. Here is the student friendly version.
- Linearity: There must be a straight line relationship between predictors and outcome.
- No multicollinearity: Predictors must not be too strongly correlated with each other. Use Analyze Correlate Bivariate to check.
- Normality: Residuals should be normally distributed.
- Homoscedasticity: Residuals must have equal variance across all values.
SPSS produces plots that make these assumptions easy to check.
Step 3: How to Run Regression in SPSS
- Step 1: Click Analyze in the top menu.
- Step 2: Click Regression.
- Step 3: Select Linear…
- SPSS opens the Linear Regression window.
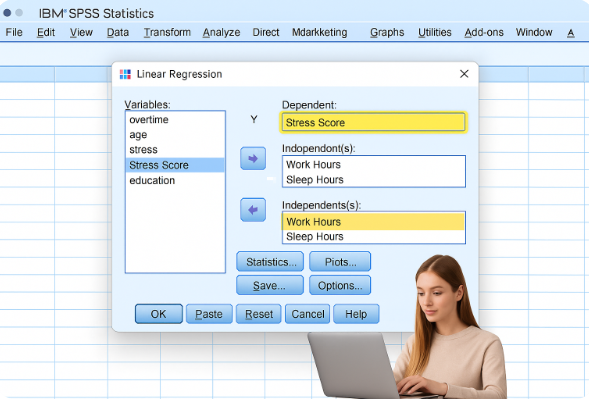
Step 4: Select Variables
- Move your dependent variable into:
Dependent → Y
Example: Stress Score
- Move your independent variables into:
Independent(s) → X
Examples: Work Hours, Sleep Hours
Step 5: Choose Regression Method
- In the “Method” dropdown, select: ENTER (recommended and widely accepted)
- Press OK.
- SPSS will generate the output.
Step 6: Interpret SPSS Regression Output (Clear & Simple)
SPSS generates several tables. Here is how to interpret each one:
- Descriptive Statistics Table
Shows means and standard deviations.
Used for understanding your sample, not reporting regression.
2. Correlations Table
Shows relationships between variables.
This helps identify multicollinearity.
3. Model Summary Table
Contains the key values:
R: Correlation between predicted and actual values.
R²: Explains how much of Y is predicted by your X variables.
Example: R² = .41 → 41% of the outcome is explained.
Adjusted R²: Use this for APA reporting (more accurate).
4. ANOVA Table
Shows whether your overall model is significant.
Check:
- F-value
- Sig. (p-value)
If p < .05, your regression model is statistically significant.
5. Coefficients Table (Most Important)
This is the core of regression interpretation.
Values include:
- B (unstandardized coefficient)
- Beta (standardized coefficient)
- t-value
- p-value
- 95% Confidence Interval
Interpretation rules:
- If p < .05 → predictor is significant
- Positive Beta → increases the outcome
- Negative Beta → decreases the outcome
Example SPSS Interpretation (Easy to Understand)
Imagine your output shows:
- Work Hours → β = .52, p < .001
- Sleep Hours → β = –.31, p = .004
- Adjusted R² = .41
Interpretation:
Work hours significantly predicted stress levels (β = .52, p < .001), indicating that longer work hours increased stress. Sleep hours were also a significant predictor (β = –.31, p = .004), showing that fewer sleep hours increased stress. The model explained 41% of the variance in stress (Adjusted R² = .41).
How to Write Regression Results in APA Style
Here is a complete APA example you can use in assignments or dissertations:
A multiple linear regression was conducted to predict stress levels based on work hours and sleep hours. The overall model was significant, F(2, 117) = 26.42, p < .001, and explained 41% of the variance in stress (Adjusted R² = .41). Work hours were a significant positive predictor (β = .52, p < .001), while sleep hours were a significant negative predictor (β = –.31, p = .004).
Common SPSS Regression Problems Students Face
- And how to fix them:
“No Valid Cases”
- Your missing values aren’t defined properly.
Predictors not significant
- Check sample size, assumptions, or variable coding.
Multicollinearity
- Predictors are too strongly correlated.
Wrong test selection
- Students sometimes choose the wrong model—ask if unsure.
To solve these issues, you can request:
When Should You Use Regression?
Use regression when:
- Your outcome is continuous
- You want to predict Y from X
- You have 1 or more predictors
- Relationships look linear
- You want to measure the effect size
- You need a results chapter for your dissertation
Conclusion
Running regression in SPSS becomes simple once you understand:
- How to prepare your dataset
- How to check assumptions
- How to run the analysis
- How to interpret the output
- How to write results in APA format
This tutorial gives you everything you need to run regression correctly for your homework, class project, or research study.
If you want expert-level SPSS results, APA tables, or interpretation help, our statisticians can complete your full analysis with accuracy and clarity.