How to Run Logistic Regression in SPSS (Step-by-Step Guide for Students)
Logistic regression is one of the most commonly used statistical techniques in academic research, especially in psychology, nursing, public health, business, and social sciences. Unlike linear regression, which predicts a continuous outcome, logistic regression is used when your dependent variable is binary, meaning it has only two possible outcomes such as yes or no, pass or fail, employed or unemployed.
Many students struggle with logistic regression in SPSS because it involves both statistical reasoning and correct software setup. Choosing the wrong variable type, misinterpreting odds ratios, or misunderstanding model fit statistics can easily lead to incorrect results and lost marks.
This complete guide explains how to run logistic regression in SPSS step by step, how to interpret the output correctly, and how to report results in APA style. It is written specifically for students working on assignments, projects, theses, or dissertations.
If you need hands-on support, expert guidance is available through SPSS Dissertation Help, SPSS Help for Students, and SPSS Output Interpretation Help.
What Is Logistic Regression in SPSS?
Logistic regression is a statistical method used to examine the relationship between one binary dependent variable and one or more independent variables. The goal is to estimate the probability that a specific outcome occurs.
Common examples of logistic regression
- Predicting whether a student passes or fails an exam
- Predicting whether a patient has a disease or not
- Predicting whether an employee leaves a job or stays
- Predicting whether a customer purchases or does not purchase
In SPSS, logistic regression uses a logit function, which transforms probabilities into log-odds. This allows the model to handle outcomes that are limited to two categories.
When Should You Use Logistic Regression?
You should use logistic regression in SPSS when all of the following conditions are met:
- Your dependent variable has two categories only (binary)
- The dependent variable is coded numerically (e.g., 0 and 1)
- Your independent variables can be:
- Continuous (e.g., age, income, hours worked)
- Categorical (e.g., gender, education level)
- You want to predict probability, not a continuous score
If your dependent variable has more than two categories, you may need multinomial logistic regression instead.
Step 1: Prepare Your Data Correctly in SPSS
Before running logistic regression, your dataset must be structured properly. Many SPSS errors occur at this stage.
Data View setup
- Each row represents one participant
- Each column represents one variable
- Your dependent variable must be coded as 0 and 1
- Example:
- 0 = No
- 1 = Yes
- Example:
Variable View setup
- Dependent variable:
- Measure = Nominal
- Values = clearly labeled (e.g., 0 = No, 1 = Yes)
- Independent variables:
- Continuous predictors → Measure = Scale
- Categorical predictors → Measure = Nominal
Incorrect coding is one of the most common reasons logistic regression fails or produces invalid results.
Step 2: Check Logistic Regression Assumptions
Although logistic regression is flexible, it still has assumptions that must be checked.
Key assumptions
- The dependent variable is binary
- Observations are independent
- No extreme multicollinearity among predictors
- Large enough sample size (at least 10–20 cases per predictor)
Unlike linear regression, logistic regression does not require normality or homoscedasticity, which makes it suitable for many real-world datasets.
Step 3: Run Logistic Regression in SPSS
Follow these steps carefully in SPSS.
SPSS menu path
- Click Analyze
- Select Regression
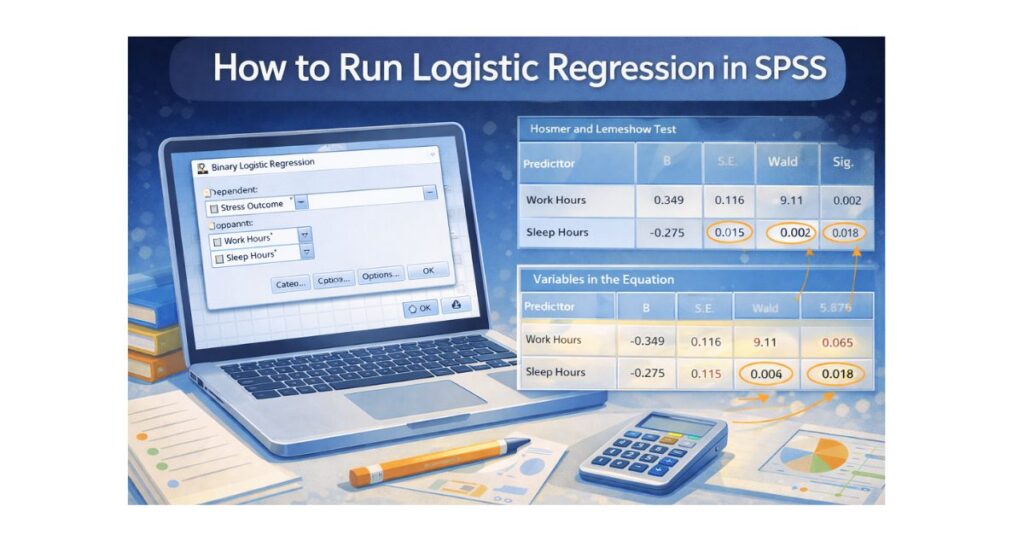
- Choose Binary Logistic
- Move your dependent variable into Dependent
- Example: Stress Outcome (0 = No, 1 = Yes)
- Move your independent variables into Covariates
- Example: Work Hours, Sleep Hours
- If you have categorical predictors:
- Click Categorical
- Move categorical variables
- Choose reference category
- Click OK
SPSS will now generate the logistic regression output.
Step 4: Understand Logistic Regression Output in SPSS
SPSS produces several tables. Students often feel overwhelmed at this stage, so let’s break each one down clearly.
Block 0: Model Without Predictors
This table shows how well SPSS predicts outcomes without any predictors. It acts as a baseline.
You do not interpret this section deeply, but it helps you compare improvement once predictors are added.
Omnibus Tests of Model Coefficients
This table answers one key question:
Does the model with predictors perform better than a model without predictors?
How to interpret
- Look at the Sig. value
- If p < .05 → the model is statistically significant
Example interpretation
The logistic regression model was statistically significant, χ²(2) = 24.81, p < .001, indicating that the predictors significantly improved model fit.
Model Summary Table
This table includes:
- Cox & Snell R²
- Nagelkerke R²
These values represent pseudo R², which indicate how much variation is explained by the model.
Example
- Nagelkerke R² = .34
This means the model explains 34% of the variance in the outcome.
Hosmer–Lemeshow Test
This test evaluates model fit.
How to interpret
- p > .05 → good model fit
- p < .05 → poor model fit
This is one of the most misunderstood tests among students.
Classification Table
This table shows how accurately the model predicts outcomes.
You will see:
- Percentage correctly classified
- Sensitivity and specificity
Example:
The model correctly classified 78.4% of cases.
Variables in the Equation (Most Important Table)
This is the most critical table in logistic regression.
Key columns to interpret:
- B (log-odds coefficient)
- Wald statistic
- Sig. (p-value)
- Exp(B) → odds ratio
Understanding odds ratios
- Exp(B) > 1 → predictor increases odds
- Exp(B) < 1 → predictor decreases odds
- Exp(B) = 1 → no effect
Example interpretation
Work hours significantly predicted stress outcome, Exp(B) = 1.42, p = .002, indicating that each additional hour of work increased the odds of experiencing stress by 42%.
Step 5: Report Logistic Regression Results in APA Style
APA reporting is required in most universities.
Example APA write-up
A binary logistic regression was conducted to examine whether work hours and sleep hours predicted stress outcome. The model was statistically significant, χ²(2) = 24.81, p < .001, and explained 34% of the variance in stress (Nagelkerke R² = .34). Work hours significantly increased the odds of stress, Exp(B) = 1.42, p = .002, while sleep hours significantly reduced the odds, Exp(B) = 0.76, p = .01.
Common Mistakes Students Make in Logistic Regression
- Using a continuous dependent variable
- Forgetting to define categorical variables
- Misinterpreting odds ratios as percentages
- Ignoring model fit tests
- Reporting B instead of Exp(B)
- Failing to explain direction of effects
Avoiding these errors greatly improves your grade and research quality.
When Logistic Regression Is Not Appropriate
Do not use logistic regression if:
- Your dependent variable has more than two categories
- Your sample size is extremely small
- Your predictors are perfectly correlated
Final Thoughts
Learning how to run logistic regression in SPSS is an essential skill for modern research. Once you understand how the model works, how SPSS generates output, and how to interpret odds ratios, logistic regression becomes manageable and even intuitive.
If you feel unsure at any stage, professional support is available through SPSSdissertationhelp.com
Our experts help students run correct logistic regression models, interpret results accurately, and write clean APA-formatted results ready for submission.