
Repeated Measures ANOVA SPSS Help | Dissertation Statistics Support
If you’re measuring the same participants more than once, comparing scores across several related conditions, or tracking outcomes over multiple time points, you’re probably looking at a repeated measures ANOVA. It’s one of the more common tests in dissertation research, and also one of the more misunderstood. Between structuring the dataset correctly, sorting out sphericity, deciding which correction to trust, and turning SPSS output into a results section your committee will accept, there are a lot of places to get stuck.
That’s where we come in. SPSS Dissertation Help supports students, PhD candidates, and researchers through every stage of a repeated measures ANOVA in SPSS, from checking whether the test even fits your design, through data setup, assumption testing, running the analysis, and writing up the results in APA 7th edition format. Whether you’re stuck at the sphericity table or just want someone to double check your output before you write Chapter 4, we can help.
Expert Help With Repeated Measures ANOVA in SPSS
Our SPSS repeated measures ANOVA help covers the full analysis process, not just one piece of it. Depending on where you are in your research, we can help you with:
Deciding whether repeated measures ANOVA is actually the right test for your research questions and data structure, rather than a mixed ANOVA, MANOVA, or a linear mixed model. Preparing your dataset in the wide format SPSS requires for within subjects designs. Defining your within subject factors correctly in the Repeated Measures dialog box. Running a one-way repeated measures ANOVA SPSS analysis when you have a single within subjects factor. Running a two-way repeated measures ANOVA SPSS analysis when your design includes two within subjects factors. Running a mixed ANOVA SPSS analysis when your design combines a within subjects factor with a between subjects grouping variable. Checking assumptions, including sphericity, and interpreting what SPSS is telling you when those assumptions are violated. Reading and interpreting the full set of SPSS output tables. Writing up your findings in clear, dissertation ready APA format.
Clients working with us can receive cleaned data, SPSS syntax, the full SPSS output file, assumption test results, APA formatted tables, figures where appropriate, and written interpretation you can adapt directly into your results chapter.
What Is Repeated Measures ANOVA?
Repeated measures ANOVA is a statistical test used to compare means across three or more related conditions, time points, or measurements collected from the same group of participants. Because the same people are measured repeatedly, the observations aren’t independent, which is exactly why this test exists instead of a standard between groups ANOVA.
A few examples of how this shows up in real dissertation research:
Anxiety scores measured before treatment, immediately after treatment, and at a follow up appointment. Test scores compared across three different instructional methods, with the same students exposed to each one. Patient outcomes tracked across multiple clinic visits. Employee satisfaction measured at several points across a training or organizational change initiative.
If your design only involves two related measurements rather than three or more, a paired samples t test is usually the more appropriate, and simpler, choice. We can help you figure out which test actually fits before you invest time running the wrong one.
When Should You Use Repeated Measures ANOVA in SPSS?
Repeated measures ANOVA tends to be a good fit when:
Your dependent variable is continuous. The same participants are measured repeatedly under different conditions or at different time points. You have three or more related conditions or time points to compare. Your research question is about whether mean scores change or differ across those repeated measurements.
It’s usually not the right tool when:
Your groups are independent rather than repeated on the same people, in which case a between subjects ANOVA would be more appropriate. Your dependent variable is categorical rather than continuous. Assumption violations are severe enough that the standard test isn’t trustworthy, even with corrections. Missing data across time points are extensive, which can distort a repeated measures design more than other analyses. Your design calls for something more flexible, like a linear mixed model, particularly with unbalanced or heavily missing longitudinal data.
If you’re not sure which category your study falls into, send us your design and variables and we’ll tell you honestly whether repeated measures ANOVA is the right call.
Our Repeated Measures ANOVA SPSS Services
Data Preparation and Variable Setup
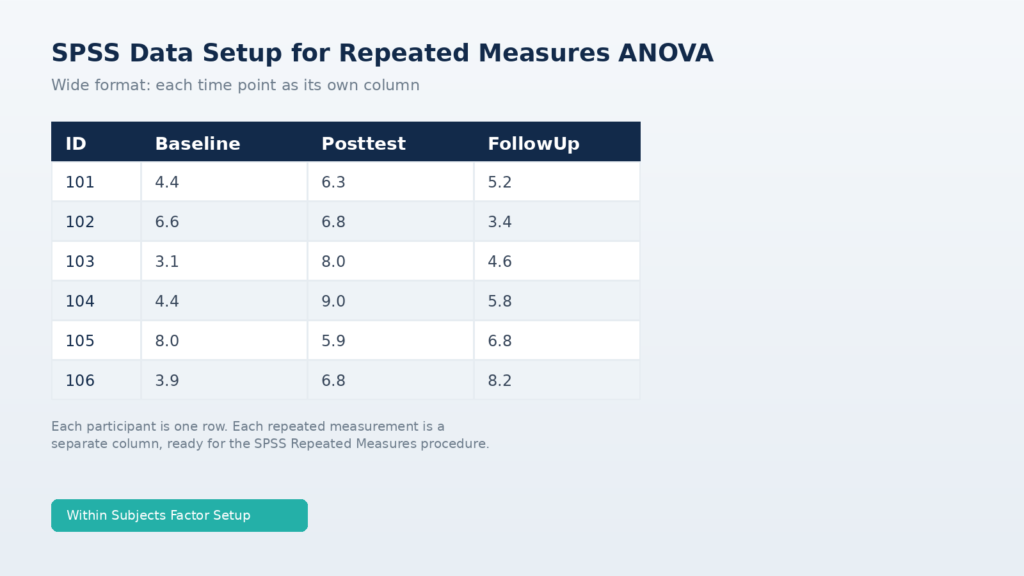
SPSS is particular about how repeated measures data needs to be arranged, and this is where a lot of students run into trouble before the analysis even starts. Each repeated measurement typically needs to appear as its own column, rather than being stacked in long format. For example, if you’re measuring anxiety at baseline, posttest, and follow up, you’d need three separate columns, one for each time point, rather than a single “anxiety score” column with a separate variable indicating time. We help you restructure or clean your dataset so it’s ready for the Repeated Measures procedure in SPSS.
Assumption Testing
Before trusting any repeated measures ANOVA result, a handful of assumptions need to hold up:
The dependent variable is continuous (interval or ratio). Observations are related, since the same participants are measured repeatedly. There are no extreme outliers distorting the repeated measurements. The repeated measurements are approximately normally distributed. The assumption of sphericity is met.
We check these assumptions against your actual data and explain, in plain language, what to do if one of them doesn’t hold, whether that means applying a correction, transforming a variable, or reconsidering the analysis altogether.
Mauchly’s Test of Sphericity
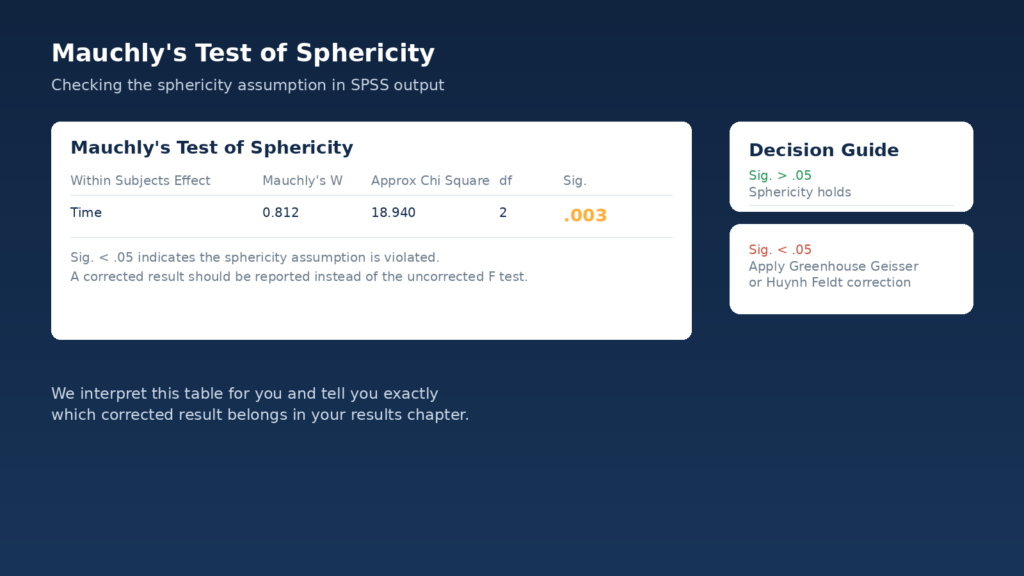
Mauchly’s test of sphericity evaluates whether the variances of the differences between all pairs of repeated measurements are roughly equal. When this assumption is violated, meaning Mauchly’s test comes back significant, the standard, uncorrected repeated measures ANOVA result becomes less trustworthy, because it increases the risk of a false positive. In that case, a corrected F test is usually the better choice to report.
Greenhouse Geisser and Huynh Feldt Corrections
When sphericity is violated, SPSS automatically provides two adjusted results in the output: the Greenhouse Geisser correction and the Huynh Feldt correction. Both adjust the degrees of freedom to produce a more conservative, more accurate p value. As a general guideline, Greenhouse Geisser tends to be reported when the epsilon estimate is lower, indicating a more severe sphericity violation, while Huynh Feldt is sometimes preferred when epsilon is closer to 1. We’ll walk you through which correction fits your specific output rather than leaving you to guess.
Post Hoc and Pairwise Comparisons
A statistically significant repeated measures ANOVA only tells you that at least one pair of means differs somewhere among your conditions. It doesn’t tell you which ones. That’s where pairwise comparisons come in. We typically help interpret Bonferroni adjusted pairwise comparisons, which control for the increased risk of false positives that comes from running multiple comparisons, so you can identify exactly where the meaningful differences lie.
APA 7th Edition Reporting
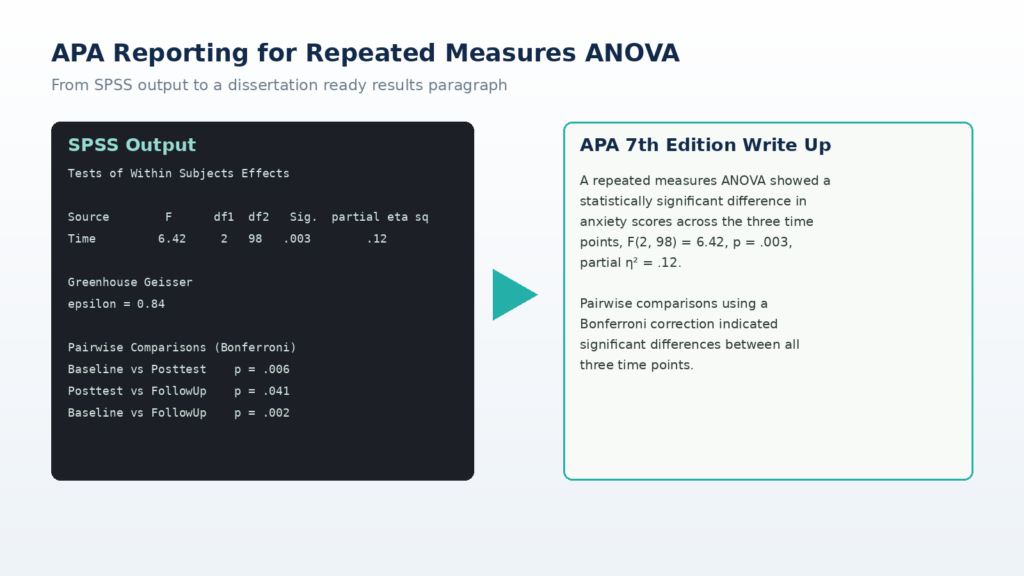
Once the analysis is done, the results need to be written up in a format your committee expects. We provide repeated measures ANOVA APA reporting that follows APA 7th edition conventions, including an example of what that looks like in practice:
A repeated measures ANOVA showed a statistically significant difference in anxiety scores across the three time points, F(2, 98) = 6.42, p = .003, partial η² = .12.
The exact wording, degrees of freedom, and effect size will depend entirely on your actual SPSS output. We build the write up around your real results, not a generic template.
One-Way Repeated Measures ANOVA in SPSS
A one-way repeated measures ANOVA SPSS analysis is used when you have a single within subjects factor with three or more repeated levels, for example, comparing the same participants’ stress ratings across three consecutive weeks of an intervention. This is the most common form of repeated measures ANOVA in dissertation work, and it’s typically the starting point when a study involves just one repeated factor.
Two-Way Repeated Measures ANOVA in SPSS
A two-way repeated measures ANOVA SPSS analysis applies when your design includes two within subjects factors instead of one, for instance, measuring performance across three training sessions and under two different task conditions, with every participant experiencing all combinations. This design allows you to examine main effects for each factor as well as the interaction between them.
Mixed ANOVA in SPSS
Mixed ANOVA SPSS analysis, also called a split plot ANOVA, is used when your design has at least one within subjects factor and one between subjects factor. A typical dissertation example is comparing a treatment group and a control group, the between subjects factor, on outcomes measured at three time points, the within subjects factor. This lets you test whether change over time differs depending on group membership, a common question in intervention and treatment outcome research.
What You Receive From Our SPSS Repeated Measures ANOVA Help
- Cleaned SPSS dataset, if your data needs restructuring
- SPSS syntax for the analysis
- Full SPSS output file
- Assumption test results, including sphericity
- Repeated measures ANOVA tables
- Post hoc or pairwise comparison tables
- APA 7th edition write up
- Interpretation of your findings in plain academic language
- A dissertation ready results section
- A clear explanation of both significant and non significant findings
Why Choose SPSS Dissertation Help?
We focus specifically on dissertation level statistics, not generic tutoring. That means our support is built around what committees and chairs actually expect to see in a results chapter: clear SPSS output interpretation, properly formatted APA tables, and explanations that hold up when your committee asks follow up questions. We help with SPSS data analysis help across Chapter 4, support revisions when a committee member requests changes, and explain every finding in language you can defend during your defense, not just jargon copied from output.
Common Problems We Fix
Some of the most frequent issues we see from students who come to us after getting stuck:
Data entered in long format when SPSS needs wide format for repeated measures. The within subjects factor defined incorrectly in the Repeated Measures dialog box. Confusion over what Mauchly’s test result actually means for the analysis. Uncertainty about whether to report the uncorrected result, Greenhouse Geisser, or Huynh Feldt. Missing or misinterpreted pairwise comparisons. Incorrect or incomplete APA reporting, such as missing effect sizes or degrees of freedom. Mixing up p values with effect sizes when explaining significance. Not knowing whether the design actually calls for repeated measures ANOVA or a mixed ANOVA instead.
If any of this sounds familiar, we can review what you have and help you sort it out.
Need help running or interpreting repeated measures ANOVA in SPSS? Send us your research questions, variables, and dataset, and we’ll help you prepare the analysis, run the correct SPSS procedure, interpret the output, and report the results in APA format.
For related support, take a look at our broader SPSS data analysis help services, our dissertation statistics help page, our dedicated ANOVA in SPSS help guide, our SPSS output interpretation page, and our APA statistics reporting help resource.
Frequently Asked Questions
It’s a statistical test in SPSS used to compare means across three or more related conditions or time points measured on the same participants, rather than on separate independent groups.
Use it when your dependent variable is continuous, the same participants are measured under three or more related conditions, and you want to know whether their mean scores differ across those conditions.
A standard one way ANOVA compares means across independent groups of different participants. Repeated measures ANOVA compares means across related measurements taken from the same participants, which requires accounting for the correlation between those measurements.
Mauchly’s test checks the sphericity assumption, whether the variances of the differences between all pairs of repeated measurements are roughly equal. A significant result means this assumption has been violated.
If Mauchly’s test is significant, it’s generally more appropriate to report a corrected result, such as the Greenhouse Geisser or Huynh Feldt correction, rather than the uncorrected F test.
Yes. We provide a full APA 7th edition write up based on your actual SPSS output, including F statistics, degrees of freedom, p values, and effect sizes.
Yes, it’s a commonly used and well accepted test for dissertation research involving repeated measurements, provided your design and data meet the assumptions of the test.
Ideally your raw dataset, an SPSS .sav file if you have it, a description of your research questions and variables, and any existing output or syntax you’ve already produced. If you’re unsure what to send, just reach out and we’ll walk you through it.