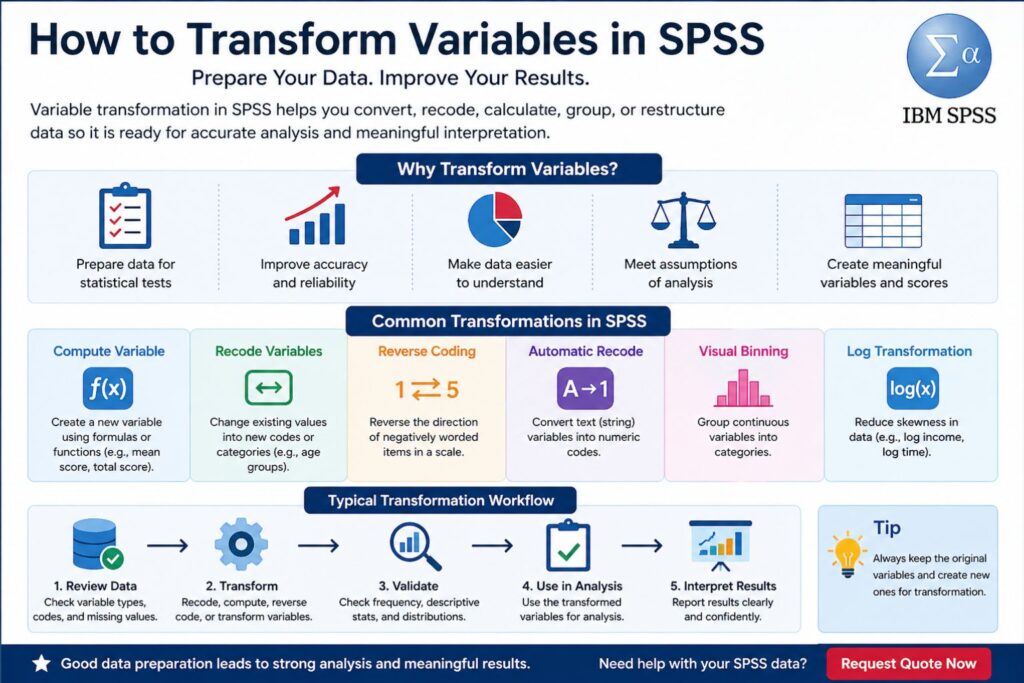
How to Transform Variables in SPSS
Transforming variables in SPSS is a major part of preparing data for accurate statistical analysis. Many research datasets are not ready for analysis immediately after data entry, import, or survey download. Some variables may need to be recoded, grouped, reversed, averaged, converted, standardized, or adjusted before the results can properly answer the research questions.
This step is especially important in dissertation research because raw questionnaire data often needs careful preparation before final analysis. Several Likert-scale items may need to be combined into one scale score. A negatively worded item may need reverse coding. A continuous variable such as age may need to be grouped for demographic reporting. A skewed variable such as income or response time may need transformation before regression, correlation, t-tests, or ANOVA.
When variable transformation is handled properly, the results become clearer, more reliable, and easier to interpret. When it is handled poorly, the final output may look complete but still fail to represent the research accurately.
For dissertation-level support with SPSS data preparation, analysis, and interpretation, visit SPSS Dissertation Help or send your details through Request Quote Now.
What Does It Mean to Transform Variables in SPSS?
To transform variables in SPSS means to change the structure, coding, or format of existing data so that it becomes suitable for analysis. The purpose is to make the dataset match the research design, hypotheses, measurement scales, and statistical tests.
A variable transformation may create a new score from several questionnaire items, change text responses into numeric codes, reverse the direction of a scale item, group continuous values into categories, or reduce the effect of skewness. These changes help SPSS produce output that is easier to understand and more closely aligned with the research question.
SPSS includes several transformation options under the Transform menu, including Compute Variable, Recode into Different Variables, Automatic Recode, Visual Binning, and Rank Cases. Each option serves a different purpose depending on the type of variable and the analysis being prepared.
Why Variable Transformation Matters in Dissertation Research
Variable transformation matters because the quality of the analysis depends on the quality of the prepared data. A dataset can appear complete while still containing coding issues, inconsistent item direction, unsuitable variable formats, missing value problems, or variables that do not match the planned test.
In dissertation work, transformed variables often become the variables used in Chapter 4. The final correlation table, regression model, ANOVA output, chi-square test, reliability table, or descriptive statistics may all depend on variables that were first created or corrected through transformation.
For example, a student studying employee satisfaction may collect responses from five satisfaction items. The final analysis may not use the five items separately. Instead, the researcher may create one mean satisfaction score after checking reliability. That computed variable then becomes the main variable used in correlation, regression, or group comparison.
| Research Need | Common Transformation | Example |
|---|---|---|
| Combining related survey items | Compute mean score | Average of satisfaction items |
| Correcting negative item wording | Reverse coding | 1 becomes 5, 2 becomes 4 |
| Preparing demographic summaries | Grouping | Age into age categories |
| Converting imported text data | Automatic recode | Male/Female into numeric codes |
| Reducing skewness | Log transformation | Income or response time |
| Preparing regression predictors | Dummy coding | Education level categories |
| Creating scale totals | Compute total score | Sum of anxiety items |
For broader support with analysis-ready datasets, visit SPSS Data Analysis Help.
Common Types of Variable Transformation in SPSS
Different transformation methods serve different purposes. The best method depends on the variable type, research question, measurement level, and planned analysis. A good transformation improves the connection between the data and the statistical test.
| Transformation Type | What It Does | Common Research Use |
|---|---|---|
| Compute Variable | Creates a new variable using a formula | Mean scores, total scores, percentages |
| Recode Variable | Changes values into new codes or groups | Age groups, response categories |
| Reverse Coding | Reverses the direction of values | Negatively worded survey items |
| Automatic Recode | Converts string values into numeric codes | Gender, department, education level |
| Visual Binning | Groups continuous data into categories | Income bands, score groups |
| Log Transformation | Reduces strong positive skewness | Income, cost, response time |
| Dummy Coding | Converts categories into 0/1 variables | Regression predictors |
| Centering | Subtracts the mean from a variable | Moderation analysis |
| Standardization | Converts values into z-scores | Comparing variables on different scales |
Each transformation should have a clear purpose. In academic research, this purpose usually connects to the questionnaire design, scale construction, statistical assumptions, or interpretation of the results.
Compute Variable in SPSS
The Compute Variable function is one of the most common SPSS transformation tools. It creates a new variable from existing variables using a formula. This is useful for calculating mean scores, total scores, difference scores, percentage scores, transformed scores, and interaction terms.
In dissertation analysis, Compute Variable is often used after reliability testing. Once a group of items has acceptable reliability, those items can be combined into one construct score. This score can then be used in descriptive statistics, correlation analysis, regression, t-tests, ANOVA, mediation, or moderation analysis.
Example of a Computed Mean Score
A questionnaire may include four items measuring academic motivation.
| Variable | Item Description |
|---|---|
| MOT1 | I feel motivated to complete my studies |
| MOT2 | I set clear academic goals |
| MOT3 | I work hard to achieve good results |
| MOT4 | I remain focused on academic tasks |
These four items can be combined into one average motivation score.
| New Variable | Meaning |
|---|---|
| Motivation_Mean | Average motivation score across MOT1, MOT2, MOT3, and MOT4 |
This new variable is easier to analyze than four separate items when the research question focuses on overall motivation. After the new variable is created, its descriptive statistics help confirm that the values fall within the expected range. If each item uses a 1–5 Likert scale, the mean score should also fall between 1 and 5.
For support creating clean dissertation-ready variables, visit Dissertation Data Analysis Help.
Recoding Variables in SPSS
Recoding changes the values of a variable into new values. This is common when grouping responses, simplifying categories, correcting codes, or preparing variables for a specific statistical test.
A common example is age. A dataset may contain exact ages, but the demographic table may need age groups. In that case, the original age variable can be recoded into a new grouped variable.
| Original Age Range | New Code | Value Label |
|---|---|---|
| 18–25 | 1 | 18–25 years |
| 26–35 | 2 | 26–35 years |
| 36–45 | 3 | 36–45 years |
| 46 and above | 4 | 46+ years |
Recoding into a different variable is usually safer than replacing the original variable. Keeping the original data makes it easier to check the transformation later and correct any issue if needed.
Recoding is useful in demographic analysis, chi-square tests, crosstabulation, grouped descriptive statistics, and survey reporting. It also helps when imported datasets use inconsistent labels or values that need cleaning before analysis.
For questionnaire-based projects, visit Survey Data Analysis Services.
Reverse Coding Variables in SPSS
Reverse coding is used when a scale contains negatively worded items. This is common in psychology, education, nursing, public health, business, and social science research.
For example, a confidence scale may contain mostly positive items such as “I can complete difficult tasks,” but one item may state, “I feel unable to complete difficult tasks.” If higher scores should represent higher confidence, the negative item must be reversed before reliability testing and scale scoring.
| Original Value | Reversed Value |
|---|---|
| 1 | 5 |
| 2 | 4 |
| 3 | 3 |
| 4 | 2 |
| 5 | 1 |
Reverse coding aligns the direction of all items in the scale. Without this correction, Cronbach’s alpha may become weak, the scale mean may become inaccurate, and the final interpretation may be wrong.
After reverse coding, the reversed variable should be used in reliability analysis and final score calculation. The original negatively worded item can remain in the dataset for reference, while the corrected version becomes the proper scale item.
Transforming Skewed Variables in SPSS
Some variables are not normally distributed. They may have many low values and a few very high values, creating a long tail. This is common with income, cost, hospital stay length, response time, number of errors, expenditure, and frequency counts.
When skewness is strong, it may affect parametric analysis, especially regression, correlation, t-tests, and ANOVA. In some cases, a transformation can make the distribution more suitable for analysis.
| Distribution Issue | Possible Transformation | Example Use |
|---|---|---|
| Mild positive skew | Square root transformation | Count data |
| Strong positive skew | Log transformation | Income or response time |
| Very strong positive skew | Inverse transformation | Highly skewed continuous data |
| Negative skew | Reflection followed by transformation | High-score clustered data |
A log transformation is often used when a continuous variable has strong positive skewness. For example, income may be transformed into a log income variable to reduce the effect of very large values.
| Original Variable | Transformed Variable | Purpose |
|---|---|---|
| Income | Log_Income | Reduce positive skewness |
| Response_Time | Log_Response_Time | Improve distribution |
| Cost | Log_Cost | Reduce impact of extreme values |
The transformed variable should be checked before it is used in final analysis. Histograms, skewness values, Q-Q plots, and descriptive statistics can help show whether the transformation improved the distribution.
For help with regression assumptions and transformed predictors, visit Regression Analysis Help.
Creating Groups from Continuous Variables
Continuous variables are sometimes grouped to make descriptive reporting easier. Age, income, test scores, years of experience, and satisfaction scores may be converted into categories for tables and summaries.
For example, exact ages can be grouped into age bands. Income can be grouped into income levels. Test scores can be grouped into low, moderate, and high performance categories.
| Continuous Variable | Grouped Version | Common Use |
|---|---|---|
| Age | Age group | Demographic table |
| Monthly income | Income band | Participant profile |
| Years of experience | Experience level | Group comparison |
| Test score | Performance category | Academic reporting |
| Satisfaction score | Low, moderate, high | Interpretation summary |
Grouping can improve readability, but it also reduces detail. For that reason, a well-prepared dataset often keeps both versions: the original continuous variable and the grouped variable. The continuous version may be better for regression or correlation, while the grouped version may be useful for descriptive tables.
Converting String Variables to Numeric Variables
SPSS statistical procedures usually work best with numeric variables. However, data imported from Excel, Google Forms, Qualtrics, KoboToolbox, or SurveyMonkey may contain text responses.
For example, gender may appear as “Male” and “Female.” Education level may appear as “Diploma,” “Bachelor’s,” and “Master’s.” Department names, marital status, employment status, and location may also appear as text.
| String Value | Numeric Code | Value Label |
|---|---|---|
| Male | 1 | Male |
| Female | 2 | Female |
| Prefer not to say | 3 | Prefer not to say |
Automatic Recode in SPSS can convert string values into numeric codes while preserving labels. After conversion, the new variable should be checked in Variable View to confirm the value labels, measurement level, and missing values.
This transformation is especially useful before chi-square tests, crosstab analysis, logistic regression, ANOVA, and demographic summaries.
For help preparing imported datasets, visit SPSS Data Analysis Help.
Creating Dummy Variables in SPSS
Dummy variables are used when categorical predictors need to be included in regression models. A dummy variable usually uses 0 and 1 to show whether a case belongs to a category.
For example, gender may be coded as:
| Gender | Dummy Code |
|---|---|
| Female | 0 |
| Male | 1 |
For variables with more than two categories, more than one dummy variable is needed. One category becomes the reference group, and the other categories are represented by separate dummy variables.
| Education Level | Diploma Dummy | Bachelor Dummy | Reference Group |
|---|---|---|---|
| Diploma | 1 | 0 | No |
| Bachelor’s | 0 | 1 | No |
| Master’s | 0 | 0 | Yes |
The reference group affects interpretation. In the example above, Diploma and Bachelor’s categories are compared against Master’s. If the wrong reference category is selected, the regression results may become harder to explain clearly in Chapter 4.
Centering Variables for Moderation Analysis
Centering is common in moderation analysis. It involves subtracting the mean from each value of a variable. This creates a centered version of the predictor or moderator.
For example, a study may examine whether work stress moderates the relationship between leadership style and employee performance. Before creating the interaction term, the predictor and moderator may be centered.
| Variable | Transformation | Purpose |
|---|---|---|
| Predictor | Predictor minus its mean | Improve interpretation |
| Moderator | Moderator minus its mean | Reduce multicollinearity concerns |
| Interaction term | Centered predictor × centered moderator | Test moderation |
Centering does not change the relationship between variables. It changes the scale so the regression coefficients become easier to interpret. This is useful in dissertation studies involving moderation, interaction effects, PROCESS analysis, and hierarchical regression.
Creating Total Scores and Mean Scores from Likert Items
Many dissertations use Likert-scale questionnaires. These items may measure constructs such as satisfaction, motivation, anxiety, service quality, perceived usefulness, leadership style, organizational commitment, stress, or behavioral intention.
After reliability analysis, related items are often combined into a total score or mean score. Mean scores are widely used because they remain on the same scale as the original items. If the original items use a 1–5 scale, the mean score also ranges from 1 to 5.
| Scoring Method | Example | Benefit |
|---|---|---|
| Total score | Q1 + Q2 + Q3 + Q4 | Gives full scale total |
| Mean score | Average of Q1 to Q4 | Easier to interpret |
| Weighted score | Weighted item formula | Useful when items carry different weights |
A scale score should only be created after checking that the items are intended to measure the same construct. If negatively worded items exist, reverse coding must be completed before the final score is calculated.
Example SPSS Variable Transformation Workflow
A strong SPSS transformation process creates a clean path from raw data to final analysis. This helps protect the accuracy of the results and makes the analysis easier to defend.
| Stage | Action | Purpose |
|---|---|---|
| Data review | Check variable names and labels | Improve clarity |
| Coding review | Check numeric codes | Confirm consistency |
| Missing value check | Identify missing or special codes | Prevent distorted results |
| Reverse coding | Correct negative items | Align item direction |
| Reliability testing | Check internal consistency | Confirm scale quality |
| Score creation | Compute mean or total scores | Create final construct variables |
| Distribution check | Review skewness and outliers | Assess assumptions |
| Transformation | Apply justified transformations | Improve analysis fit |
| Final testing | Use prepared variables | Produce reliable results |
This workflow is useful for dissertations because it supports transparency and makes the final analysis easier to explain.
Example Transformation Summary Table
A transformation summary table can help document the data preparation process.
| Original Variable | Transformation Applied | New Variable | Reason |
|---|---|---|---|
| Q1, Q2, Q3, Q4 | Mean score | Satisfaction_Mean | Created satisfaction construct |
| Q5 | Reverse coding | Q5_R | Corrected negative wording |
| Age | Grouped into categories | Age_Group | Prepared demographic reporting |
| Income | Log transformation | Log_Income | Reduced positive skewness |
| Gender | Dummy coding | Gender_Dummy | Prepared regression predictor |
| Education | Dummy coding | Education_Dummies | Prepared categorical predictor |
This kind of table is useful for methodology notes, data preparation records, and results chapter clarity.
Sample Dissertation Write-Up for Transformed Variables
The dataset was reviewed before analysis to confirm that the variables were correctly coded and suitable for the planned statistical tests. Negatively worded questionnaire items were reverse coded so that higher scores consistently represented higher levels of the measured construct. Composite scores were created by calculating the mean of related Likert-scale items after reliability analysis. Age was grouped for demographic reporting, while the original continuous age variable was retained for analysis where appropriate. The income variable showed positive skewness, so a log-transformed version was created and assessed before inferential testing.
This wording gives the reader a clear explanation of how the variables were prepared without making the results chapter sound mechanical.
Common Mistakes When Transforming Variables in SPSS
Variable transformation can improve data quality, but errors at this stage can affect the whole analysis. Small mistakes such as incorrect reverse coding, missing value problems, or unclear labels can lead to weak or misleading findings.
| Mistake | Why It Matters | Better Practice |
|---|---|---|
| Replacing the original variable | Raw data may be lost | Create a new transformed variable |
| Incorrect reverse coding | Scale direction becomes wrong | Check item wording carefully |
| Missing value codes left untreated | Means and totals may be distorted | Define missing values before analysis |
| Grouping too early | Useful detail may be lost | Keep the original continuous variable |
| No value labels | Output becomes hard to read | Label all coded values |
| Transforming without a clear reason | Interpretation becomes weak | Link transformation to research design |
| Not checking the new variable | Errors may go unnoticed | Run descriptive statistics after transformation |
A careful review after every transformation helps protect the final results.
When Variable Transformation Makes Sense in SPSS
Variable transformation works best when it improves the fit between the dataset, the research question, and the planned statistical analysis. In dissertation research, this often includes creating scale scores, correcting negatively worded items, preparing demographic categories, converting text values into numeric codes, or improving the distribution of skewed variables.
A good transformation has a clear reason. It supports accuracy, improves interpretation, and keeps the analysis aligned with the study design. Transformations lose value when they are used only to chase significant results or force the data into a preferred outcome.
Related SPSS Support
Variable transformation is often part of a wider SPSS analysis process. Some projects only need recoding or scale scoring, while others need full data cleaning, assumption testing, statistical analysis, and results interpretation.
Related SPSS support is available for different research needs. SPSS Dissertation Help covers broader dissertation projects, while SPSS Data Analysis Help focuses on analysis preparation and interpretation. Researchers working on full dissertation datasets can also use Dissertation Data Analysis Help. For questionnaire-based projects, Survey Data Analysis Services offers support with survey coding, cleaning, analysis, and reporting.
Support with SPSS Variable Transformation
Many dissertation datasets need careful preparation before final analysis. Problems such as incorrect coding, missing value errors, poorly labeled variables, wrong reverse scoring, or unsuitable variable formats can affect the quality of the results chapter.
Professional SPSS support can help ensure that the dataset is clean, the transformations are correct, and the final variables match the planned analysis. This is especially useful for survey research, Likert-scale analysis, regression models, group comparisons, and Chapter 4 reporting.
For help with your dataset, visit SPSS Dissertation Help or send your details through Request Quote Now.
FAQs About How to Transform Variables in SPSS
What does it mean to transform variables in SPSS?
Transforming variables in SPSS means changing, creating, or reorganizing variables so they are suitable for statistical analysis. This may include recoding, reverse coding, computing scale scores, grouping values, or applying log transformations.
Why is variable transformation important in SPSS?
Variable transformation improves the structure and quality of the dataset before analysis. It helps ensure that variables match the research questions, statistical tests, and interpretation needs.
What is the most common variable transformation in SPSS?
One of the most common transformations is computing mean scores from Likert-scale items. This is often used when several questionnaire items measure one construct.
What is reverse coding in SPSS?
Reverse coding changes the direction of a variable’s values. In a 1–5 scale, a reverse-coded item usually changes 1 to 5, 2 to 4, 3 remains 3, 4 becomes 2, and 5 becomes 1.
Why should negatively worded items be reverse coded?
Negatively worded items must be reverse coded so that all items in a scale move in the same direction. Without reverse coding, reliability and scale scores may become inaccurate.
Can SPSS transform text variables into numeric variables?
Yes. SPSS can convert string variables into numeric variables through Automatic Recode. This is useful when imported data contains text responses such as gender, education level, or department.
When is log transformation used in SPSS?
Log transformation is often used when a continuous variable has strong positive skewness. Common examples include income, cost, expenditure, and response time.
Is it good to group continuous variables in SPSS?
Grouping continuous variables can help with descriptive reporting, but it may reduce detail. The original continuous variable is usually worth keeping alongside the grouped version.
What is dummy coding in SPSS?
Dummy coding converts categorical variables into 0/1 variables for regression analysis. It allows categorical predictors such as gender, education level, or employment status to be included in regression models.
Can I get help transforming variables for my dissertation?
Yes. For support with SPSS variable transformation, data cleaning, analysis, and interpretation, visit SPSS Dissertation Help or Request Quote Now.