How to Run a Two-Way ANOVA in SPSS (Step-by-Step Guide)
Running a two-way ANOVA in SPSS is one of the most common requirements in statistics assignments, theses, and dissertations. Yet many students struggle not because the test itself is difficult, but because the steps in SPSS, the factor setup, and the output interpretation are not clearly explained in one place.
This guide explains how to run a two-way ANOVA in SPSS from start to finish, using a clear, practical workflow. The steps are written to align with how markers, supervisors, and examiners expect the analysis to be conducted and reported. All related keywords such as how to run two way ANOVA in SPSS, running a two way ANOVA in SPSS, and two way ANOVA in SPSS steps are used naturally within the explanation.
What Does “Running a Two-Way ANOVA in SPSS” Mean?
When instructors ask you how to run a two-way ANOVA in SPSS, they expect more than just clicking a few buttons. Running the test properly involves:
- Verifying that the data is entered correctly
- Selecting the correct SPSS menu and options
- Specifying a full factorial model
- Requesting the correct statistics and plots
- Interpreting the output correctly
A two-way ANOVA tests:
- The main effect of Independent Variable A
- The main effect of Independent Variable B
- The interaction effect between the two variables
SPSS performs this analysis through the General Linear Model (Univariate) procedure.
When Should You Run a Two-Way ANOVA in SPSS?
You should run a two-way ANOVA in SPSS when all of the following conditions are met:
- You have one continuous dependent variable
- You have two categorical independent variables
- Each participant belongs to one group per factor
- Observations are independent
Example Research Question
Does teaching method and gender influence exam performance?
| Variable Role | Example |
|---|---|
| Dependent variable | Exam score |
| Factor 1 | Teaching method (online vs in-person) |
| Factor 2 | Gender (male vs female) |
Step 1: Confirm Your Data Is Ready
Before you attempt to run a two-way ANOVA in SPSS, your dataset must already be prepared correctly. SPSS will not warn you if the logic is wrong; it will simply produce misleading results.
Minimum Data Requirements
- One row per participant
- One column per variable
- Dependent variable set as Scale
- Independent variables set as Nominal
If your data is not structured this way, fix it first. Many errors in running a two way ANOVA in SPSS originate at the data entry stage.
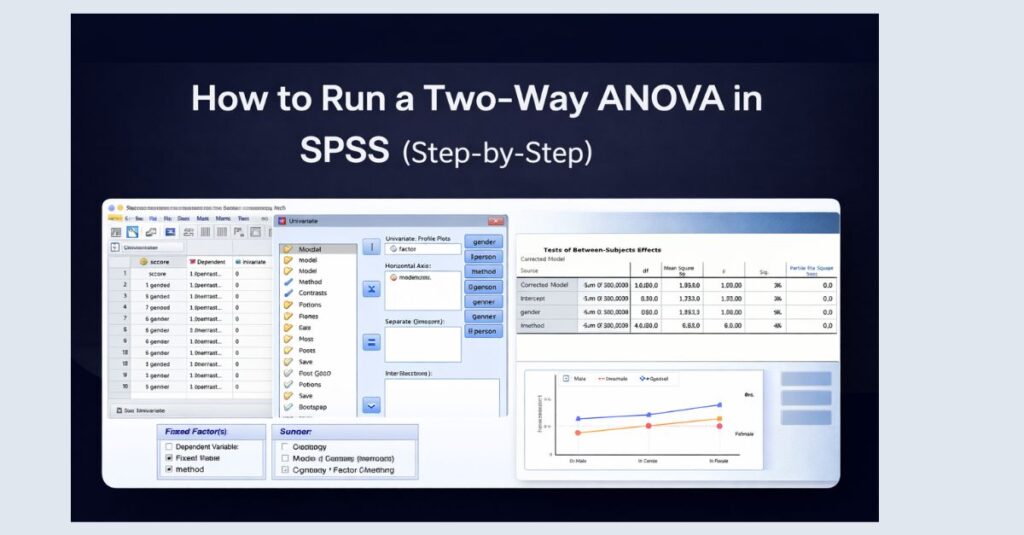
Step 2: Open the Two-Way ANOVA Dialog in SPSS
In IBM SPSS Statistics, follow this exact menu path:
Analyze → General Linear Model → Univariate
This is the correct location for:
- One-way ANOVA
- Two-way ANOVA
- Factorial ANOVA designs
Do not use the One-Way ANOVA menu when you have two independent variables.
Step 3: Assign the Dependent Variable
In the Univariate dialog box:
- Move your continuous outcome variable into Dependent Variable
For example:
score→ Dependent Variable
If SPSS does not allow the variable to move, this means it is not set as Scale in Variable View.
Step 4: Assign the Two Independent Variables (Fixed Factors)
Next, move both categorical predictors into Fixed Factor(s).
For example:
methodgender
Both variables should appear together in the Fixed Factors box. This tells SPSS that you are running a two way ANOVA, not a one-way analysis.
At this point, SPSS understands that you want:
- Main effects for each factor
- An interaction effect between the factors
Step 5: Specify the Correct Model (Critical Step)
Click Model
Select:
- Full factorial
This is one of the most important steps when learning how to run a two way ANOVA in SPSS. A full factorial model ensures that SPSS includes:
- Factor A
- Factor B
- Factor A × Factor B interaction
Leaving the default or choosing a custom model incorrectly may remove the interaction term entirely.
Click Continue.
Step 6: Request Descriptive Statistics and Effect Sizes
Click Options
Check the following boxes:
- Descriptive statistics
- Estimates of effect size
- Homogeneity tests
Move both factors into the Display Means for box if required by your assignment.
These options allow you to report:
- Group means and standard deviations
- Partial eta squared values
- Levene’s test results
All of these are expected when explaining how to conduct a two way ANOVA in SPSS in academic work.
Step 7: Add Interaction Plots (Strongly Recommended)
Click Plots
Set:
- One factor on the Horizontal Axis
- The other factor under Separate Lines
Click Add, then Continue.
Profile plots visually demonstrate whether an interaction effect exists and strengthen both interpretation and presentation.
Step 8: Run the Two-Way ANOVA in SPSS
Click OK.
SPSS will generate multiple output tables, including:
- Descriptive statistics
- Levene’s test
- Tests of Between-Subjects Effects
- Estimated marginal means
- Interaction plots
At this point, you have successfully run a two way ANOVA in SPSS.
Step 9: Identify the Key Output Table
The most important table when running a two-way ANOVA in SPSS is:
Tests of Between-Subjects Effects
This table shows:
- Main effect of Factor A
- Main effect of Factor B
- Interaction effect (Factor A × Factor B)
Each row includes:
- F value
- Degrees of freedom
- Significance (p-value)
- Partial eta squared
Step 10: How to Interpret Two-Way ANOVA Results (Briefly)
When interpreting results, always follow this order:
- Interaction effect
- If significant, interpret interaction first
- Main effects
- Interpret only if interaction is non-significant or cautiously if significant
Example Interpretation (APA Style)
A two-way ANOVA revealed a significant interaction between teaching method and gender on exam scores, F(1, 82) = 6.42, p = .013, ηp² = .07.
This structure is expected in coursework and dissertations.
Common Mistakes When Running a Two-Way ANOVA in SPSS
Students often lose marks due to the following errors:
- Using the One-Way ANOVA menu
- Forgetting to select Full factorial
- Treating categorical variables as scale
- Ignoring interaction effects
- Reporting means without ANOVA results
Avoiding these mistakes immediately improves grades and research credibility.
FAQ: How to Run a Two-Way ANOVA in SPSS
Is “two way ANOVA” the same as “factorial ANOVA”?
Yes. In SPSS, a two-way ANOVA is a type of factorial ANOVA.
Can I run a two-way ANOVA with unequal group sizes?
Yes. SPSS handles unbalanced designs, provided assumptions are met.
Do I need post hoc tests?
Post hoc tests are only needed if a factor has more than two levels.
What if assumptions are violated?
Depending on the violation, you may need transformations or alternative tests.
Final Checklist Before Submission
- Data entered correctly
- Full factorial model selected
- Interaction tested and reported
- Effect sizes included
- APA-style wording used
Need Expert Help Running a Two-Way ANOVA in SPSS?
If SPSS output is confusing or your results do not match expectations, our SPSS Dissertation Help service can support you with correct test execution, interpretation, and APA-compliant reporting.
Request a personalized quote based on your dataset, academic level, and deadline.
All quotes are confidential and obligation-free.