How to Do Partial Correlation in SPSS: A Complete Step-by-Step Guide for Researchers
Researchers often analyze relationships between variables when conducting quantitative research. However, real-world datasets rarely involve only two variables. Many additional factors influence the relationship between variables in a dataset. When researchers ignore these additional influences, simple correlation analysis may produce misleading conclusions.
Researchers solve this challenge by applying partial correlation analysis. Partial correlation allows researchers to examine the relationship between two variables while statistically controlling for the influence of another variable.
This blog explains how to do partial correlation in SPSS through a detailed step-by-step tutorial designed for graduate students, doctoral researchers, and academic professionals. The guide also explains how to interpret the SPSS output and report the findings correctly in dissertations or research papers.
SPSS remains one of the most widely used statistical software packages in academic research. Researchers rely on SPSS because it offers a clear interface, powerful statistical procedures, and reliable output tables.
If you need professional assistance conducting statistical analysis for your research project, you can Request Quote Now to receive support from an experienced statistical consultant.
Researchers who need broader assistance with quantitative analysis can also explore SPSS Data Analysis Help, Dissertation Statistics Help, and Hire Statistician for Dissertation services available on spssdissertationhelp.com.
Understanding Partial Correlation
Partial correlation measures the relationship between two variables while controlling for the influence of one or more additional variables. This statistical technique allows researchers to isolate the direct association between the primary variables of interest.
In many research scenarios, a third variable influences the relationship between two variables. Without controlling for that third variable, the correlation between the two main variables may appear stronger or weaker than it truly is.
For example, consider a researcher who studies the relationship between study hours and exam performance. Intelligence level may also influence exam scores. If the researcher calculates a simple correlation between study hours and exam performance, the results may partially reflect intelligence rather than study time alone.
Partial correlation solves this issue by removing the influence of intelligence level and calculating the relationship between study hours and exam performance independently.
Researchers frequently apply partial correlation analysis in psychology, health sciences, education research, business analytics, and social science research.
If you need expert assistance conducting statistical analysis or selecting the correct statistical method, you can Request Quote Now for professional research support.
Why Researchers Use Partial Correlation in Quantitative Studies
Many research studies involve complex relationships among variables. When researchers attempt to analyze these relationships, they often need to control for additional factors that influence the results.
Partial correlation helps researchers clarify relationships between variables while controlling for confounding factors.
Psychology researchers may study relationships between emotional behavior and stress levels while controlling for age or socioeconomic status.
Health researchers may analyze the relationship between physical activity and cardiovascular health while controlling for body mass index or smoking habits.
Education researchers may study the relationship between study techniques and academic performance while controlling for prior academic achievement.
Business researchers may analyze relationships between marketing investments and sales performance while controlling for economic conditions.
These research situations often appear in dissertations, theses, and peer-reviewed academic publications.
Researchers who require guidance selecting the correct statistical analysis can explore Statistical Data Analysis Help or Regression Analysis Help services.
If you need help conducting statistical analysis for your research project, you can Request Quote Now for expert support.
Preparing Your Dataset Before Running Partial Correlation in SPSS
Before running partial correlation analysis in SPSS, researchers must prepare their datasets carefully. Data preparation plays an important role in producing reliable statistical results.
Researchers should review the dataset to ensure that variables appear in numeric format. SPSS cannot calculate correlation coefficients using nonnumeric variables.
Researchers should also confirm that the variables represent continuous measurements whenever possible. Correlation analysis works best with interval or ratio variables.
Next, researchers should check the dataset for missing values. Missing values may distort statistical results or reduce the sample size used in the analysis.
Researchers should also examine potential outliers in the dataset. Extreme values can significantly influence correlation estimates and may lead to misleading conclusions.
Finally, researchers should examine scatterplots to confirm that the relationship between variables appears roughly linear. Correlation analysis assumes a linear relationship between variables.
Researchers who need assistance preparing datasets can explore SPSS Data Analysis Help services.
You can also Request Quote Now if you need help cleaning and preparing your research data before running statistical analysis.
Step-by-Step Guide: How to Do Partial Correlation in SPSS
Researchers can perform partial correlation analysis in SPSS by following several simple steps.
Step 1: Open Your Dataset
Start by launching SPSS and opening the dataset that contains the variables required for analysis.
Ensure that the variables appear in numeric format and that the dataset contains no obvious data errors.
Step 2: Navigate to the Correlation Menu
Click Analyze in the SPSS menu.
Select Correlate from the dropdown menu.
Choose Partial from the list of correlation procedures.
SPSS will open the Partial Correlations dialog box.
Step 3: Select the Primary Variables
Move the two variables whose relationship you want to examine into the Variables box.
These variables represent the primary relationship you want to analyze.
Step 4: Select the Control Variable
Move the variable you want to control into the Controlling for box.
This variable represents the factor whose influence will be removed from the relationship between the two main variables.
Researchers may include more than one control variable if the research design requires it.
Step 5: Select Additional Options
Click the Options button if you want SPSS to display additional descriptive statistics.
Researchers often request the following options:
Means and standard deviations
Zero-order correlations
These statistics help researchers compare simple correlations with partial correlations.
Step 6: Run the Analysis
Click OK to run the analysis.
SPSS will produce an output table showing the partial correlation coefficient, significance value, and degrees of freedom.
If you need assistance performing these steps in SPSS, you can Request Quote Now to receive professional statistical support.
Understanding the SPSS Partial Correlation Output
After running the analysis, SPSS generates a table that summarizes the results.
Researchers should examine several important elements in the output.
The partial correlation coefficient indicates the strength and direction of the relationship between the two variables after controlling for the specified variable.
The significance level, also known as the p-value, indicates whether the relationship remains statistically significant.
The degrees of freedom represent the number of observations used in the analysis after accounting for control variables.
Researchers often interpret correlation values using the following guidelines.
| Correlation Value | Interpretation |
|---|---|
| 0.00 – 0.19 | Very weak relationship |
| 0.20 – 0.39 | Weak relationship |
| 0.40 – 0.59 | Moderate relationship |
| 0.60 – 0.79 | Strong relationship |
| 0.80 – 1.00 | Very strong relationship |
Researchers should also compare the simple correlation with the partial correlation coefficient.
If the coefficient decreases substantially after controlling for a variable, that variable likely plays an important role in the relationship.
Many students struggle to interpret SPSS output tables correctly.
If you need help interpreting statistical results, you can Request Quote Now for expert assistance.
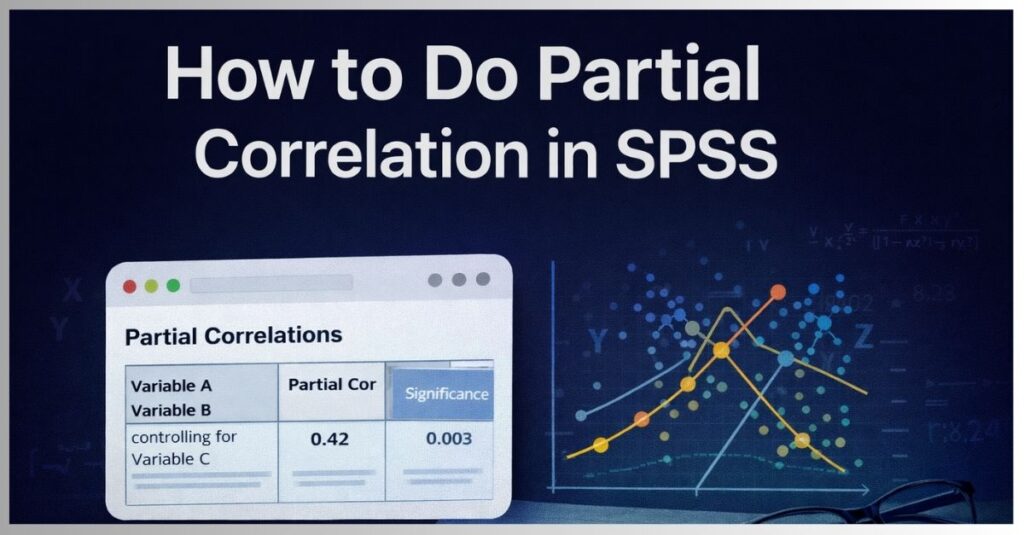
Example of Partial Correlation Interpretation
Consider a researcher studying the relationship between study hours and exam scores while controlling for intelligence level.
SPSS may produce the following output.
| Variables | Partial Correlation | p-value |
|---|---|---|
| Study Hours and Exam Score | 0.41 | 0.002 |
This result indicates a moderate positive relationship between study hours and exam scores after controlling for intelligence.
The p-value indicates that the relationship remains statistically significant.
Researchers should explain these findings clearly in the results section of their dissertation.
Researchers who need help writing the statistical results chapter can explore Dissertation Statistics Help services.
You can also Request Quote Now for assistance interpreting statistical findings.
Common Errors Researchers Make When Using Partial Correlation
Researchers sometimes misuse partial correlation analysis. These mistakes can reduce the credibility of research findings.
Some researchers choose control variables without theoretical justification.
Others ignore important statistical assumptions such as linearity and normal distribution.
Researchers may also misinterpret correlation results as evidence of causation.
Another common error occurs when researchers fail to report which variables they controlled during the analysis.
Careful research design helps researchers avoid these problems.
If you want to ensure that your statistical analysis meets academic standards, you can Request Quote Now to receive professional statistical support.
Advantages of Using SPSS for Partial Correlation
SPSS offers several advantages for researchers conducting statistical analysis.
The software provides a user-friendly interface that allows researchers to perform complex statistical procedures without writing programming code.
SPSS also produces structured output tables that researchers can easily interpret and include in research reports.
Researchers often use SPSS to conduct correlation analysis, regression modeling, factor analysis, mediation analysis, and structural equation modeling.
These statistical techniques frequently appear in graduate theses and doctoral dissertations.
Researchers who need help conducting statistical analysis using SPSS can explore SPSS Data Analysis Help, Regression Analysis Help, and Factor Analysis Help services.
If you want professional support with SPSS analysis, you can Request Quote Now for expert assistance.
Frequently Asked Questions
How do you run partial correlation in SPSS
Open Analyze → Correlate → Partial, select the two primary variables, add the control variable in the controlling box, and run the analysis.
Why do researchers use partial correlation
Researchers use partial correlation to examine the relationship between two variables while controlling for the influence of other variables.
Can SPSS control multiple variables in partial correlation
Yes. SPSS allows researchers to control for multiple variables simultaneously in partial correlation analysis.
What does a partial correlation coefficient indicate
The coefficient indicates the strength and direction of the relationship between two variables after removing the influence of control variables.
Is partial correlation used in dissertation research
Yes. Researchers frequently use partial correlation analysis in dissertations to evaluate relationships between variables while controlling for demographic or contextual factors.
If you need help conducting statistical analysis or interpreting SPSS output, you can Request Quote Now to receive professional research support.