How to Split File in SPSS
SPSS can become confusing when you need results for separate groups. You may want to know the mean stress score for males and females, satisfaction scores for different departments, pretest-posttest outcomes for intervention and control groups, or survey results by study level. Instead of running the same analysis manually for each group, SPSS has a tool called Split File.
The Split File function tells SPSS to run future analyses separately for each category of a grouping variable. For example, if you split your file by gender, SPSS will produce separate output for each gender category. If you split by treatment group, SPSS will produce separate results for each treatment group.
However, Split File does not physically divide your dataset into separate files. It only organizes your SPSS output by group. This is important because many students think they have created separate datasets, but they have only changed how SPSS produces output.
The biggest mistake students make is forgetting to turn Split File off. If Split File remains active, SPSS will continue producing grouped results for later analyses. This can affect descriptive statistics, correlations, reliability analysis, regression output, and other tests. In dissertation work, that mistake can lead to wrong interpretation, confusing tables, and unnecessary revisions.
This guide explains how to split file in SPSS, when to use Split File, when not to use it, how to read the output, how to turn it off, how to use syntax, how to avoid common mistakes, and how to report split-file results in a dissertation.
What Does Split File Mean in SPSS?
Split File in SPSS means that SPSS runs analyses separately for each group in a selected categorical variable. The dataset remains one file, but the output is divided by group.
For example, suppose your dataset includes this information:
| ID | Gender | Stress_Score |
|---|---|---|
| 001 | Female | 32 |
| 002 | Male | 28 |
| 003 | Female | 35 |
| 004 | Male | 24 |
If you split the file by Gender and run Descriptives for Stress_Score, SPSS will produce separate descriptive statistics for female participants and male participants.
This helps you answer questions such as:
- What is the mean stress score for each gender?
- Are satisfaction scores higher in one department than another?
- Do intervention and control groups show different descriptive patterns?
- Are survey responses different across study levels?
- Are clinical outcomes different across diagnosis categories?
Split File is especially useful when you need subgroup summaries before deciding which formal statistical test to run.
Split File Does Not Create Separate Datasets
A common misunderstanding is that Split File physically separates the data into new files. It does not.
Split File only changes how SPSS runs and displays future analyses. Your dataset remains intact. SPSS simply repeats the same analysis for each group.
For example, if you split by gender and run Frequencies, SPSS produces separate frequency tables for each gender. If you then run Descriptives, SPSS again separates the output by gender. This continues until you turn Split File off.
This is why Split File is powerful but risky. It saves time during subgroup analysis, but it can also affect later analyses if you forget it is still active.
Split File vs Select Cases vs Filter vs Sort Cases
Students often confuse Split File with Select Cases, Filter, and Sort Cases. These tools are different.
| SPSS feature | What it does | When to use it | Dissertation example | Main risk |
|---|---|---|---|---|
| Split File | Produces separate output for each group | When you want the same analysis repeated by group | Descriptives by gender | Forgetting to turn it off |
| Select Cases | Includes only selected cases in analysis | When you want to analyze one subgroup only | Analyze only intervention participants | Accidentally excluding data |
| Filter | Temporarily excludes some cases from analysis | When you want SPSS to ignore certain cases | Analyze only complete survey responses | Forgetting the filter is active |
| Sort Cases | Reorders the dataset by a variable | When arranging data before reviewing or grouping | Sort by participant ID or group | Thinking sorting performs analysis |
| Save As separate files | Creates separate physical files | When you truly need different datasets | Save separate files for each country | Creating too many confusing files |
The main difference is this: Split File analyzes all groups separately, while Select Cases or Filter limits the analysis to selected cases.
When Should You Use Split File in SPSS?
Use Split File when you want SPSS to repeat the same analysis separately for different groups.
Good examples include:
- Descriptive statistics by gender
- Frequencies by study level
- Mean scores by treatment group
- Reliability analysis by subgroup
- Satisfaction scores by department
- Pretest-posttest descriptive results by intervention group
- Clinical outcomes by diagnosis category
- Survey responses by country or region
- Nursing student results by program level
- Employee engagement scores by job category
- Patient satisfaction results by ward type
- Academic performance summaries by learning mode
For example, a nursing student may want separate mean medication adherence scores for intervention and control groups. A psychology student may want descriptive statistics for anxiety scores by gender. A business student may want customer satisfaction results by region.
Split File is helpful when the same procedure must be repeated across groups.
When Should You Not Use Split File in SPSS?
Split File is not always the right method. It is mainly a descriptive and output-organization tool. It does not replace formal statistical testing.
Do not use Split File when:
- You only want to analyze one subgroup.
- You want to exclude cases from the analysis.
- You need a formal test of group differences.
- You need to test an interaction effect.
- Your grouping variable has too many categories.
- Your group sizes are very small.
- Your grouping variable is continuous.
- You forgot that Split File is still active.
- You are not sure whether your research question needs a comparison test instead.
For example, if Split File shows that females have a higher mean stress score than males, that does not automatically prove the difference is statistically significant. You may still need an independent samples t test, Mann-Whitney U test, ANOVA, Kruskal-Wallis test, chi-square test, ANCOVA, or regression model depending on your variables and study design.
Decision Table: Split File, t Test, ANOVA, or Select Cases?
Use this table to choose the correct SPSS option.
| Research goal | Best SPSS option | Example |
|---|---|---|
| Show descriptive statistics separately by group | Split File | Mean stress score by gender |
| Analyze only one subgroup | Select Cases or Filter | Analyze only female participants |
| Compare two groups statistically on a continuous outcome | Independent samples t test or Mann-Whitney U test | Stress score by gender |
| Compare three or more groups statistically on a continuous outcome | ANOVA or Kruskal-Wallis test | Satisfaction score by department |
| Compare categorical variables | Chi-square test | Gender by completion status |
| Test whether a relationship differs by group | Regression with interaction term | Does intervention effect differ by gender? |
| Review subgroup patterns before formal testing | Split File | Descriptives by intervention status |
Split File is useful for exploring and summarizing groups, but formal group comparisons require the appropriate inferential test.
Before You Split File in SPSS: Preparation Checklist
Before using Split File, check your data carefully. This prevents incorrect grouped output and interpretation errors.
| What to check | Why it matters |
|---|---|
| Backup copy | Protects your original dataset |
| Grouping variable | Split File needs a clear group variable |
| Variable type | The split variable should usually be categorical |
| Value labels | Output is easier to read when categories are labelled |
| Missing group values | Missing categories may affect output |
| Group sizes | Very small groups may produce weak summaries |
| Frequency table | Confirms category coding before splitting |
| Sort option | Helps organize grouped output |
| Output option | Choose Compare Groups or Organize Output by Groups |
| Split File status | Know how to turn Split File off after analysis |
Before splitting, run Frequencies on your grouping variable.
For example, if Gender is coded as:
| Code | Label |
|---|---|
| 1 | Male |
| 2 | Female |
Confirm that the labels are correct before running Split File. If gender is miscoded, all split-file output will also be wrong.
How to Split File in SPSS Using the Menu
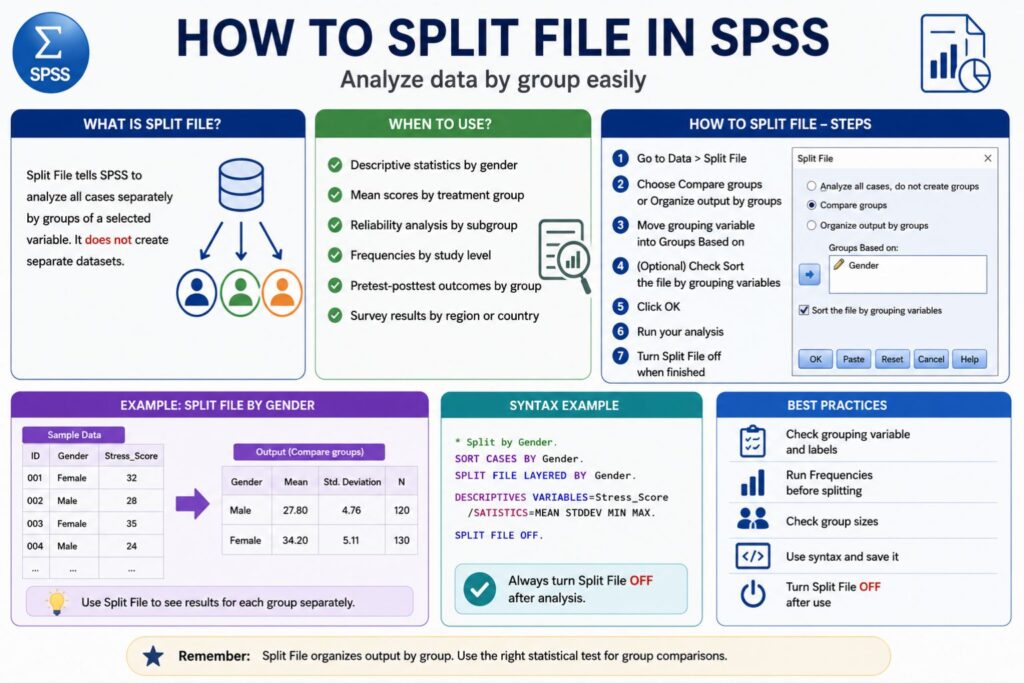
Follow these steps to split file in SPSS:
- Open your dataset in SPSS.
- Click Data in the top menu.
- Select Split File.
- Choose Compare groups or Organize output by groups.
- Move your grouping variable into the Groups Based on box.
- Select Sort the file by grouping variables if needed.
- Click OK.
- Run your analysis.
- Review the grouped output.
- Turn Split File off when finished.
The Split File window gives three important options:
| Option | Meaning |
|---|---|
| Analyze all cases, do not create groups | Turns Split File off |
| Compare groups | Shows group results close together in output tables |
| Organize output by groups | Creates separate output sections for each group |
For most student projects, Compare groups is easier for quick subgroup summaries. Organize output by groups is useful when each group produces longer output.
Compare Groups vs Organize Output by Groups in SPSS
SPSS allows you to display split-file output in two main ways.
| Option | What it does | Best use | Example |
|---|---|---|---|
| Compare groups | Places group results near each other | Quick side-by-side subgroup review | Mean stress score by gender |
| Organize output by groups | Creates separate output sections for each group | Longer subgroup output | Reliability analysis by treatment group |
Use Compare groups when you want a compact table that helps you compare groups quickly.
Use Organize output by groups when the output is long or when you want each group separated clearly.
For dissertation work, Compare Groups is often better for descriptive tables. Organize Output by Groups may be better when reviewing detailed reliability output, frequencies, or subgroup diagnostics.
Example 1: How to Split File in SPSS by Gender
Suppose you have a student stress dataset.
| ID | Gender | Age | Stress_Score | Satisfaction_Score |
|---|---|---|---|---|
| 001 | Female | 22 | 32 | 4 |
| 002 | Male | 24 | 28 | 5 |
| 003 | Female | 23 | 35 | 3 |
| 004 | Male | 25 | 24 | 4 |
You want separate descriptive statistics for males and females.
Steps:
- Go to Data > Split File.
- Select Compare groups.
- Move Gender into the Groups Based on box.
- Click OK.
- Go to Analyze > Descriptive Statistics > Descriptives.
- Move Stress_Score and Satisfaction_Score into the Variables box.
- Click OK.
SPSS will produce separate descriptive results for each gender group.
How to Interpret the Output
After splitting by gender, check:
- The number of cases in each group
- The mean score for each group
- The standard deviation for each group
- The minimum and maximum values
- Whether any group has too few cases
- Whether missing values are affecting one group more than another
For example, if females have a mean stress score of 34 and males have a mean stress score of 26, you can describe that pattern. However, you cannot claim that the difference is statistically significant unless you run the correct inferential test.
Example 2: Split File by Treatment Group in SPSS
A dissertation student is evaluating an intervention. The dataset includes:
| ID | Group | Pretest_Score | Posttest_Score | Change_Score |
|---|---|---|---|---|
| 001 | Intervention | 52 | 75 | 23 |
| 002 | Control | 50 | 58 | 8 |
| 003 | Intervention | 55 | 78 | 23 |
| 004 | Control | 53 | 60 | 7 |
The student wants descriptive statistics for pretest, posttest, and change scores separately for the intervention and control groups.
Steps:
- Go to Data > Split File.
- Select Compare groups.
- Move Group into the Groups Based on box.
- Click OK.
- Run Descriptives for Pretest_Score, Posttest_Score, and Change_Score.
SPSS will produce separate descriptive output for the intervention and control groups.
What the Output Can and Cannot Tell You
The output can show:
- Mean pretest score for each group
- Mean posttest score for each group
- Mean change score for each group
- Variation within each group
- Whether one group appears to improve more descriptively
The output cannot, by itself, prove:
- The intervention worked
- The groups are statistically different
- The treatment caused the change
- The change is significant
To test statistical differences, you may need a paired-samples t test, independent samples t test, repeated-measures ANOVA, ANCOVA, Mann-Whitney U test, Wilcoxon signed-rank test, or regression model depending on your research design.
Example 3: Split File for Nursing or Health Research Data
A nursing or public health student may want to analyze outcomes by diagnosis group, intervention status, ward type, medication adherence category, or patient education group.
Example dataset:
| ID | Ward_Type | Age | Satisfaction_Score | Medication_Adherence |
|---|---|---|---|---|
| 001 | Medical | 61 | 4 | 88 |
| 002 | Surgical | 55 | 3 | 72 |
| 003 | Medical | 64 | 5 | 91 |
| 004 | Surgical | 59 | 4 | 80 |
If the file is split by Ward_Type, SPSS can produce separate descriptive statistics for medical and surgical ward participants.
This helps the student identify subgroup patterns before writing the results chapter. However, any claim about a significant difference between ward types still requires an appropriate statistical test.
SPSS Split File Syntax
SPSS syntax is useful because it creates a record of your data analysis steps. This is valuable in dissertation work because it helps you document exactly what was done.
Syntax to Split File by Gender
SORT CASES BY Gender.
SPLIT FILE LAYERED BY Gender.
Syntax to Run Descriptives After Splitting
DESCRIPTIVES VARIABLES=Stress_Score Satisfaction_Score
  /STATISTICS=MEAN STDDEV MIN MAX.
Syntax to Split File by Treatment Group
SORT CASES BY Group.
SPLIT FILE LAYERED BY Group.
Syntax to Turn Split File Off
SPLIT FILE OFF.
Always include SPLIT FILE OFF. after completing subgroup analysis. This prevents later analyses from being unintentionally grouped.
How to Turn Off Split File in SPSS
Turning off Split File is essential. Many SPSS errors happen because students forget this step.
To turn off Split File using the menu:
- Go to Data.
- Click Split File.
- Select Analyze all cases, do not create groups.
- Click OK.
To turn off Split File using syntax:
SPLIT FILE OFF.
After turning it off, run a simple frequency or descriptive output to confirm that SPSS is no longer separating results by group.
Warning: Split File Can Affect Later Analyses
Do not leave Split File active after subgroup analysis.
If Split File is still active, SPSS may continue producing separate output for:
- Frequencies
- Descriptives
- Crosstabs
- Correlations
- Reliability analysis
- Regression
- Nonparametric tests
- Some model output
- Other statistical procedures
This can lead to confusing dissertation tables and incorrect interpretation. Before running your final analysis, always check that Split File is off unless you intentionally need grouped output.
How to Know Split File Is Still Active
Split File may still be active if:
- SPSS keeps showing output by group.
- Tables appear repeatedly for each category.
- Descriptive statistics are separated by subgroup.
- Correlation or reliability output appears under group headings.
- Your output is much longer than expected.
- Your group variable appears as a layer in output.
When this happens, go to Data > Split File and select Analyze all cases, do not create groups.
Common Split File Mistakes in SPSS
| Problem | Likely cause | How to fix it |
|---|---|---|
| SPSS still gives grouped output | Split File was not turned off | Select Analyze all cases, do not create groups |
| Output is too long | Grouping variable has too many categories | Use a simpler grouping variable |
| Groups are too small | Split variable creates small subgroups | Check group sizes before analysis |
| Wrong groups appear | Group variable is miscoded | Run Frequencies and correct value labels |
| Missing group categories | Grouping variable has missing values | Check and recode missing values |
| Later analyses look strange | Split File was active unintentionally | Turn it off and rerun the analysis |
| Continuous variable used as split variable | Age, income, or score was used directly | Recode into categories if grouping is needed |
| Split File confused with Select Cases | Student wanted only one subgroup | Use Select Cases instead |
| Descriptive output treated as significance | Split File only produced subgroup summaries | Run the correct inferential test |
| Syntax file lacks Split File Off | Analysis record is incomplete | Add SPLIT FILE OFF. after subgroup analysis |
The safest habit is to turn Split File off immediately after the grouped output is produced.
How to Report Split File Results in a Dissertation
Split File results are usually reported as subgroup descriptive statistics. They are useful for showing how results vary across groups, but they do not automatically prove statistical significance.
Example 1: Descriptive Reporting by Treatment Group
Descriptive statistics were examined separately by treatment group using the Split File function in SPSS. The intervention group had a mean posttest score of X, while the control group had a mean posttest score of Y. A separate inferential test was conducted to determine whether the difference between groups was statistically significant.
Example 2: Reporting by Gender
The dataset was split by gender to examine descriptive patterns in stress scores. Female participants had a mean stress score of X, compared with Y among male participants. These descriptive findings were used to summarize subgroup patterns before formal group comparison.
Example 3: Reporting by Study Level
Descriptive results were reviewed separately by study level. Undergraduate students had a mean satisfaction score of X, while postgraduate students had a mean satisfaction score of Y. The split-file output was used for subgroup description rather than statistical significance testing.
These examples are useful because they make a clear distinction between descriptive subgroup results and formal hypothesis testing.
APA-Style Reporting Examples for Split File Output
Although Split File itself is not usually reported as a statistical test, the descriptive results can be presented in APA-style language.
Example:
Participants’ stress scores were examined separately by gender. Female participants reported a higher mean stress score (M = 34.20, SD = 5.11) than male participants (M = 27.80, SD = 4.76). These results were descriptive and were followed by an independent samples t test to evaluate whether the difference was statistically significant.
Another example:
Descriptive statistics were produced separately for the intervention and control groups. The intervention group showed a higher mean change score (M = 12.40, SD = 3.25) than the control group (M = 5.80, SD = 2.94). Inferential testing was conducted separately to evaluate the group difference.
This wording helps avoid overstating what Split File output can prove.
Best Practices for Using Split File in Dissertation Data Analysis
Use Split File carefully, especially when preparing dissertation results.
Best practices include:
- Use clear categorical grouping variables.
- Check value labels before splitting the file.
- Run Frequencies on the grouping variable first.
- Avoid grouping variables with too many categories.
- Check sample size in each group.
- Keep syntax for reproducibility.
- Turn Split File off immediately after use.
- Document why subgroup analysis was performed.
- Use inferential tests when making statistical comparisons.
- Do not treat descriptive split-file output as proof of significance.
- Save your output before changing Split File settings.
- Rerun key analyses if Split File was accidentally left on.
A strong SPSS workflow is:
- Check the grouping variable.
- Run Frequencies.
- Turn Split File on.
- Run the subgroup analysis.
- Save or export the output.
- Turn Split File off.
- Continue with the next analysis.
Internal Links to Add
Add these internal links naturally if the pages exist on spssdissertationhelp.com:
| Anchor text | Best placement |
|---|---|
| SPSS dissertation data analysis help | In the introduction or CTA section |
| SPSS data analysis help | In the “When to Get SPSS Help” section |
| data cleaning in SPSS | In the preparation checklist section |
| SPSS help for students | In the conclusion |
| dissertation statistics help | In the decision table or CTA section |
| quantitative data analysis help | In the introduction or best practices section |
| how to merge files in SPSS | In the preparation or related tutorial context |
Use internal links naturally. Do not force them into every section.
When to Get SPSS Help With Split File Analysis
You may need SPSS help if you are unsure whether Split File is the correct option for your dissertation analysis. This is common when students are working with subgroup analysis, pretest-posttest outcomes, unequal group sizes, small samples, or complex research questions.
You may need support if:
- You are unsure whether to use Split File, Select Cases, or Filter.
- You need subgroup descriptive tables.
- You need formal group comparisons.
- You are analyzing pretest-posttest outcomes by group.
- You need help interpreting SPSS output.
- Your supervisor asks for clean dissertation tables.
- You need APA-style statistical reporting.
- Your data has small or unequal group sizes.
- Your SPSS output looks confusing after using Split File.
- You need help deciding whether to run t tests, ANOVA, chi-square, regression, or nonparametric tests.
At SPSS Dissertation Help, we support students with data preparation, subgroup analysis, SPSS output interpretation, statistical testing, APA-style reporting, and dissertation results writing. If you are unsure whether Split File is appropriate for your research question, we can help you choose the right SPSS procedure and present your results clearly.
Frequently Asked Questions About Split File in SPSS
What does Split File do in SPSS?
Split File tells SPSS to run future analyses separately for each category of a selected grouping variable. It organizes output by group without creating separate datasets.
Does Split File create separate datasets?
No. Split File does not physically create separate datasets. It only separates the analysis output by group.
How do I split file in SPSS by gender?
Go to Data > Split File, select Compare groups or Organize output by groups, move Gender into the grouping box, and click OK.
What is the difference between Compare Groups and Organize Output by Groups?
Compare Groups places results for different groups close together in the same output tables. Organize Output by Groups creates separate output sections for each group.
How do I turn off Split File in SPSS?
Go to Data > Split File, select Analyze all cases, do not create groups, and click OK. You can also use the syntax SPLIT FILE OFF.
Why is SPSS still showing results by group?
SPSS is probably still using Split File. Turn it off by selecting Analyze all cases, do not create groups in the Split File dialog.
Can I split file by more than one variable?
Yes. SPSS allows splitting by more than one grouping variable. However, this can create many small subgroups and very long output, so use it carefully.
Should I split file by a continuous variable?
Usually no. A continuous variable such as age, income, or total score may create too many categories. If needed, recode it into meaningful groups first.
Is Split File the same as Select Cases?
No. Split File analyzes all groups separately. Select Cases includes only selected cases in the analysis.
Can Split File be used for t tests or ANOVA?
Split File can organize some output by group, but it is not a replacement for t tests or ANOVA. Use the correct inferential test when your goal is to compare groups statistically.
Why is my SPSS output too long after Split File?
Your grouping variable may have too many categories, or Split File may still be active. Turn it off if you no longer need subgroup output.
How do I report Split File results in a dissertation?
Report Split File results as subgroup descriptive statistics. If you are making claims about group differences, also report the appropriate inferential test.
Conclusion
Knowing how to split file in SPSS is important when you need subgroup analysis for dissertation, thesis, survey, clinical, education, psychology, business, or public health data. Split File lets you run the same analysis separately by group, such as gender, treatment group, study level, department, diagnosis category, ward type, country, or intervention status.
Split File does not physically divide your dataset. It only organizes future output by group until you turn it off. That is why you must always check whether Split File is active before running the next analysis.
Use Compare Groups when you want group results displayed close together. Use Organize Output by Groups when you want separate output sections for each group. Use proper inferential tests when your research question asks whether groups are statistically different.
A strong SPSS workflow includes checking the grouping variable, running Frequencies, using Split File carefully, saving syntax, interpreting output correctly, and turning Split File off after subgroup analysis.
If your dissertation analysis involves subgroup results, pretest-posttest outcomes, group comparisons, or confusing SPSS output, SPSS Dissertation Help can assist with data preparation, SPSS analysis, output interpretation, APA-style reporting, and dissertation results writing.