Simple vs Multiple Regression in SPSS: Differences, Examples, Assumptions, and Interpretation
Regression analysis is widely used in dissertation and thesis research because it helps examine whether one or more variables predict an outcome. In SPSS, two of the most common regression methods are simple regression and multiple regression.
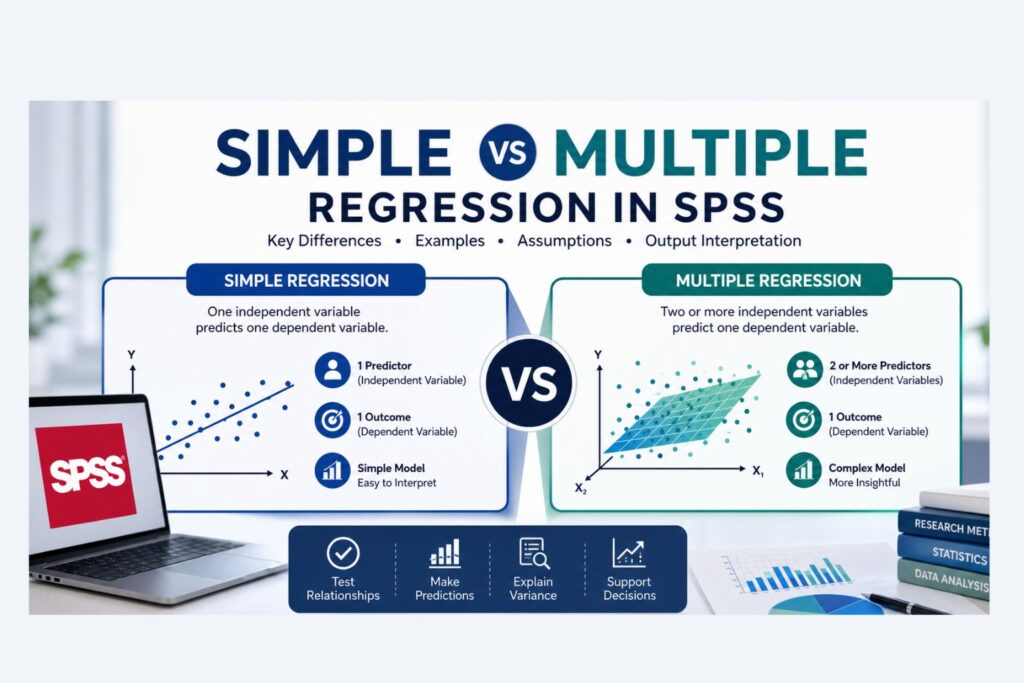
Although both methods are used for prediction, they are not the same. Simple regression uses one independent variable to predict one dependent variable. Multiple regression uses two or more independent variables to predict one dependent variable.
This difference affects the research question, hypothesis, SPSS setup, assumption checks, output interpretation, and dissertation write up. A study with one predictor usually requires simple regression. A study with several predictors usually requires multiple regression.
Choosing the correct method is important because SPSS can still produce output even when the wrong model is selected. The output only becomes useful when the analysis matches the research design, variable structure, and measurement level.
Need help choosing the correct regression model for your study? Request Quote Now
What Is Regression Analysis in SPSS?
Regression analysis is a statistical method used to examine the relationship between a dependent variable and one or more independent variables. The dependent variable is the outcome being predicted. The independent variable is the factor used to explain or predict that outcome.
For example, if a researcher wants to know whether study hours predict exam scores, exam score is the dependent variable, and study hours is the independent variable.
| Variable Type | Meaning | Example |
|---|---|---|
| Dependent variable | The outcome being predicted | Exam score |
| Independent variable | The predictor used to explain the outcome | Study hours |
Regression is common in SPSS because many dissertation questions are based on prediction, influence, explanation, or relationships between variables. Business students may use regression to predict sales. Psychology students may use regression to predict stress or anxiety scores. Healthcare and nursing students may use regression to predict patient satisfaction or treatment outcome scores.
Regression analysis is useful because it does more than show whether variables are related. It can estimate how much of the dependent variable is explained by the predictor or predictors. This makes regression especially useful for research questions that require statistical support.
For broader SPSS support, visit SPSS Data Analysis Help.
Why Simple and Multiple Regression Are Often Confused
Simple regression and multiple regression are often confused because both methods are usually accessed through the same SPSS menu:
Analyze > Regression > Linear
The difference is not mainly the SPSS menu. The difference is the number of independent variables included in the model.
| Regression Type | Dependent Variable | Independent Variables |
|---|---|---|
| Simple regression | One | One |
| Multiple regression | One | Two or more |
This means two students may open the same Linear Regression dialog box in SPSS but run different models. If one predictor is entered, the model is simple regression. If two or more predictors are entered, the model is multiple regression.
The distinction matters because the output must be interpreted differently. In simple regression, the main coefficient represents the relationship between one predictor and the outcome. In multiple regression, each coefficient represents the relationship between one predictor and the outcome while the other predictors are included in the model.
SPSS will not automatically decide whether the selected model fits the dissertation question. The researcher must confirm that the method matches the research question, hypothesis, and variables.
Simple vs Multiple Regression: Quick Comparison
The easiest way to separate the two methods is by looking at the research question.
Simple regression usually answers:
Does X predict Y?
Multiple regression usually answers:
Do X1, X2, X3, and X4 predict Y?
In both methods, there is one dependent variable. The difference is the number of independent variables used to predict it.
| Method | Basic Structure | Example |
|---|---|---|
| Simple regression | One predictor and one outcome | Does study time predict exam score? |
| Multiple regression | Several predictors and one outcome | Do study time, attendance, and motivation predict exam score? |
Simple regression is more direct because only one predictor is involved. Multiple regression is more detailed because several predictors are evaluated within the same model.
What Is Simple Regression in SPSS?
Simple regression in SPSS is used when one independent variable predicts one dependent variable. It is called simple because the model contains only one predictor.
Example research question:
Does study time predict academic performance?
| Variable | Role |
|---|---|
| Study time | Independent variable |
| Academic performance | Dependent variable |
This is simple regression because one predictor is used to explain one outcome.
Simple regression is appropriate when the research question focuses on a direct relationship between two variables. It is often used when a dissertation has one main predictor of interest and does not require other variables to be controlled.
Simple regression is not weak simply because it uses one predictor. A simple model is appropriate when it matches the research design. A focused research question with one predictor should not be forced into multiple regression unless there is a clear reason to include additional predictors.
When to Use Simple Regression
Simple regression is suitable when the study has one dependent variable and one independent variable. The dependent variable is usually continuous, such as a score, amount, index, scale, or measured outcome.
Simple regression is appropriate when:
- The research question focuses on one predictor
- The dependent variable is continuous
- The independent variable is used to predict the outcome
- The hypothesis involves one predictor and one outcome
- No additional control variables are required
- The relationship between the variables is expected to be linear
- The model is intentionally focused and direct
For example, a dissertation may examine whether training hours predict employee productivity. If training hours is the only predictor and productivity score is the only outcome, simple regression is appropriate.
Simple regression works well for focused hypotheses, pilot studies, undergraduate research, master’s dissertations, and direct predictor outcome models.
Examples of Simple Regression Research Questions
The table below shows how simple regression can apply across different academic fields.
| Field | Simple Regression Research Question |
|---|---|
| Education | Does study time predict exam performance? |
| Business | Does advertising spend predict monthly sales? |
| Psychology | Does stress level predict sleep quality score? |
| Healthcare | Does exercise frequency predict BMI? |
| Marketing | Does brand trust predict customer loyalty score? |
| Nursing | Does waiting time predict patient satisfaction score? |
| Finance | Does income predict savings amount? |
| Management | Does training duration predict employee productivity? |
| Social sciences | Does social support predict wellbeing score? |
| Human resources | Does job training predict employee confidence? |
Each example has one independent variable and one dependent variable.
In the question “Does advertising spend predict monthly sales?”, advertising spend is the independent variable, and monthly sales is the dependent variable. Since only one predictor is included, the correct model is simple regression.
What Is Multiple Regression in SPSS?
Multiple regression in SPSS is used when two or more independent variables predict one dependent variable. It is called multiple regression because the model includes multiple predictors.
Example research question:
Do study time, attendance, and motivation predict academic performance?
| Variable | Role |
|---|---|
| Study time | Independent variable |
| Attendance | Independent variable |
| Motivation | Independent variable |
| Academic performance | Dependent variable |
This is multiple regression because three independent variables are used to predict one dependent variable.
Multiple regression is useful when an outcome may be influenced by several factors. In real dissertation research, many outcomes are not explained by one variable alone. Academic performance may depend on study time, attendance, motivation, access to resources, and prior achievement. Employee performance may depend on training, experience, job satisfaction, workload, and leadership support.
For focused support with this method, visit Multiple Regression Analysis in SPSS.
When to Use Multiple Regression
Multiple regression is suitable when the study has one dependent variable and two or more independent variables. The dependent variable is usually continuous, while the independent variables may be continuous or categorical if they are coded correctly.
Multiple regression is appropriate when:
- The research question includes several predictors
- The dissertation model has multiple independent variables
- The study needs to control for other variables
- The researcher wants to compare the strength of predictors
- The model is based on a theoretical or conceptual framework
- The dependent variable is predicted by more than one factor
- The analysis needs to show which variables remain significant when tested together
For example, a dissertation may examine whether leadership style, job satisfaction, and workload predict employee performance. Since the model has several predictors and one outcome, multiple regression is the appropriate choice.
Multiple regression should not be used only because it looks more advanced. Every predictor should be justified by the research question, literature review, theory, or conceptual framework.
Examples of Multiple Regression Research Questions
The table below shows examples of multiple regression across different research areas.
| Field | Multiple Regression Research Question |
|---|---|
| Education | Do study time, attendance, motivation, and internet access predict exam performance? |
| Business | Do price, advertising spend, and product quality predict sales revenue? |
| Psychology | Do workload, stress, and social support predict burnout? |
| Healthcare | Do age, diet, exercise, and medication adherence predict blood pressure? |
| Marketing | Do brand trust, service quality, and perceived value predict customer loyalty? |
| Nursing | Do communication quality, waiting time, and staff responsiveness predict patient satisfaction? |
| Finance | Do income, debt level, credit score, and employment status predict financial risk score? |
| Management | Do leadership style, job satisfaction, and workload predict employee productivity? |
| Public health | Do income, access to care, and health literacy predict treatment adherence? |
| Human resources | Do training, leadership support, and motivation predict employee retention? |
Each example includes one dependent variable and two or more independent variables.
In the question “Do leadership style, job satisfaction, and workload predict employee productivity?”, employee productivity is the dependent variable. Leadership style, job satisfaction, and workload are the independent variables. Since more than one predictor is included, the correct model is multiple regression.
Simple vs Multiple Regression: Detailed Comparison Table
| Category | Simple Regression | Multiple Regression |
|---|---|---|
| Number of dependent variables | One | One |
| Number of independent variables | One | Two or more |
| Main purpose | Tests whether one predictor explains an outcome | Tests whether several predictors explain an outcome |
| Basic research question | Does X predict Y? | Do X1, X2, and X3 predict Y? |
| Example | Does study time predict exam score? | Do study time, attendance, and motivation predict exam score? |
| SPSS menu | Analyze > Regression > Linear | Analyze > Regression > Linear |
| Interpretation level | More direct | More detailed |
| Model Summary focus | R Square | R Square and Adjusted R Square |
| Coefficients table | One predictor coefficient | Several predictor coefficients |
| Additional diagnostic concern | Standard regression assumptions | Standard assumptions plus multicollinearity |
| Best use | One predictor hypothesis | Multi predictor research model |
| Common mistake | Using it when several predictors exist | Adding predictors without justification |
Simple and multiple regression should not be treated as competing methods. They answer different research questions. A simple model can be the correct choice when only one predictor is being tested. A multiple model is appropriate when the research design includes several predictors.
Simple Regression Dissertation Example
Consider a dissertation topic on online learning and academic performance.
Possible topic:
The effect of online learning time on academic performance among university students.
Possible research question:
Does online learning time predict academic performance?
| Variable | Role |
|---|---|
| Online learning time | Independent variable |
| Academic performance | Dependent variable |
This is simple regression because there is one independent variable and one dependent variable.
Possible hypothesis:
Online learning time significantly predicts academic performance among university students.
This model is focused. It does not test attendance, motivation, internet access, study environment, or other predictors. It only tests whether online learning time predicts academic performance.
The advantage of this model is clarity. The limitation is that it does not account for other factors that may also influence academic performance. If the dissertation’s literature review identifies several important factors, a multiple regression model may be more suitable.
Multiple Regression Dissertation Example
Now consider a broader dissertation topic on academic performance.
Possible topic:
Factors influencing academic performance among university students.
Possible research question:
Do online learning time, attendance, motivation, and internet access predict academic performance?
| Variable | Role |
|---|---|
| Online learning time | Independent variable |
| Attendance | Independent variable |
| Motivation | Independent variable |
| Internet access | Independent variable |
| Academic performance | Dependent variable |
This is multiple regression because several independent variables are included in the same model.
Possible hypothesis:
Online learning time, attendance, motivation, and internet access significantly predict academic performance among university students.
This model is more detailed because it tests several predictors together. It can show whether online learning time still predicts academic performance after attendance, motivation, and internet access are considered.
Multiple regression is useful when the dissertation framework includes several related factors and the researcher needs to understand their combined and individual contributions.
Why the Difference Matters in Dissertation Research
The difference between simple and multiple regression matters because the statistical test must match the research question and hypothesis.
If the research question asks whether one predictor affects one outcome, simple regression may be enough. If the research question asks whether several predictors affect one outcome, multiple regression is usually more appropriate.
Using the wrong model can create several problems:
- The analysis may not answer the research question
- The hypothesis may not be tested correctly
- Important predictors may be ignored
- The results chapter may become difficult to defend
- The methodology chapter may not align with the analysis
- The examiner may question the statistical decision
- The interpretation may become incomplete or misleading
A strong dissertation analysis is not based on choosing the most complicated method. It is based on choosing the method that correctly answers the research question.
For regression support, visit Regression Analysis Help.
Can You Run Separate Simple Regressions Instead of Multiple Regression?
This is one of the most common dissertation mistakes.
A student may have one dependent variable and several independent variables, then decide to run several simple regressions separately. For example:
- Study time predicting academic performance
- Attendance predicting academic performance
- Motivation predicting academic performance
- Internet access predicting academic performance
Each test may be simple regression by itself, but this approach does not answer the same question as multiple regression.
Separate simple regressions show whether each predictor is related to the outcome on its own. Multiple regression shows whether each predictor still matters when the other predictors are included in the same model.
| Approach | What It Answers | Limitation |
|---|---|---|
| Separate simple regressions | Does each predictor individually predict the outcome? | Does not show the unique effect of each predictor after controlling for the others |
| Multiple regression | Which predictors explain the outcome when tested together? | Requires careful assumption checks and interpretation |
For dissertation research, multiple regression is usually more appropriate when the research question includes several predictors in one model. Separate simple regressions may be useful for preliminary analysis, but they should not automatically replace multiple regression.
This distinction matters because a variable may appear significant in a simple regression but become non significant in a multiple regression after related predictors are added.
How to Choose Between Simple and Multiple Regression
The decision depends mainly on the number of independent variables and the structure of the research question.
| Question | If Your Answer Is Yes | Suggested Method |
|---|---|---|
| Do you have one dependent variable? | Yes | Regression may be suitable |
| Is the dependent variable continuous? | Yes | Linear regression may be suitable |
| Do you have only one independent variable? | Yes | Simple regression |
| Do you have two or more independent variables? | Yes | Multiple regression |
| Do you need to control for other variables? | Yes | Multiple regression |
| Do you want to compare which predictor is strongest? | Yes | Multiple regression |
| Is the dependent variable ordered categorical? | Yes | Another regression type may be needed |
A study with one predictor and one continuous outcome usually fits simple regression. A study with several predictors and one continuous outcome usually fits multiple regression.
The regression method should be selected before running SPSS. The software can calculate results, but it cannot decide whether the model is conceptually correct.
Need help checking your model before analysis? Request Quote Now
SPSS Setup for Simple and Multiple Regression
Simple and multiple regression are commonly run through the same SPSS menu:
Analyze > Regression > Linear
The difference is what goes into the Dependent box and the Independent(s) box.
| Model | Dependent Box | Independent(s) Box |
|---|---|---|
| Simple regression | One dependent variable | One independent variable |
| Multiple regression | One dependent variable | Two or more independent variables |
For simple regression, one predictor is entered into the Independent(s) box. For multiple regression, two or more predictors are entered.
The setup difference affects the meaning of the coefficient table. In simple regression, the coefficient reflects the relationship between one predictor and the outcome. In multiple regression, each coefficient reflects the relationship between one predictor and the outcome while the other predictors are included in the model.
This is why multiple regression requires more careful interpretation.
How to Run Simple Regression in SPSS
Simple regression is usually run through the Linear Regression menu in SPSS.
Step 1: Prepare the Dataset
The dataset should be checked before analysis. The dependent variable should be continuous, the independent variable should be appropriate for regression, and missing values should be handled properly.
Outliers should also be reviewed because extreme values can affect regression results. Variable names should be clear enough to identify which variable is the predictor and which variable is the outcome.
For help preparing your dataset, visit Help With SPSS Analysis.
Step 2: Open the Regression Menu
In SPSS, go to:
Analyze > Regression > Linear
This opens the Linear Regression dialog box.
Step 3: Add the Dependent Variable
The outcome variable should be placed into the Dependent box.
Example:
Academic performance score
Step 4: Add the Independent Variable
The predictor variable should be placed into the Independent(s) box.
Example:
Study time
Step 5: Select Useful Statistics
Common options include estimates, model fit, confidence intervals, descriptives, and residual diagnostics if required by the dissertation or university guidelines.
Step 6: Review the Output
SPSS will usually produce Model Summary, ANOVA, and Coefficients tables. These tables show whether the model is significant, how much variance is explained, and whether the predictor is statistically significant.
How to Run Multiple Regression in SPSS
Multiple regression is also run through the Linear Regression menu, but it requires more careful setup because several predictors are involved.
Step 1: Prepare the Dataset
All variables should be properly coded before running the model. The dependent variable should be continuous, and categorical predictors may need dummy coding depending on the research design.
Missing values, outliers, and variable distributions should be reviewed. The relationships among predictors should also be checked because highly related predictors can create multicollinearity problems.
Step 2: Open the Regression Menu
In SPSS, go to:
Analyze > Regression > Linear
Step 3: Add the Dependent Variable
The outcome variable should be placed into the Dependent box.
Example:
Employee performance score
Step 4: Add the Independent Variables
All predictors should be placed into the Independent(s) box.
Example predictors:
- Job satisfaction
- Workload
- Leadership support
- Training hours
Step 5: Select Useful Statistics
For multiple regression, useful options may include estimates, model fit, confidence intervals, descriptives, collinearity diagnostics, and residual plots.
Collinearity diagnostics are especially important because they help detect whether predictors are too highly related.
Step 6: Review the Output
SPSS will usually produce Model Summary, ANOVA, Coefficients, and Collinearity Statistics. The output should be interpreted at both the model level and the predictor level.
For help with this method, visit Multiple Regression Analysis in SPSS.
Which SPSS Output Table Matters Most?
SPSS regression output can feel overwhelming because several tables are produced at once. The most important table depends on the research question.
| SPSS Output Table | Simple Regression | Multiple Regression |
|---|---|---|
| Model Summary | Shows how much variance one predictor explains | Shows how much variance all predictors explain together |
| ANOVA | Shows whether the model is significant | Shows whether the full model is significant |
| Coefficients | Shows whether the one predictor is significant | Shows which predictors are significant after controlling for others |
| Collinearity Statistics | Usually not central | Important for checking multicollinearity |
| Residual plots | Useful for assumptions | Useful for assumptions |
In simple regression, the Coefficients table is usually easier to read because only one predictor is tested. In multiple regression, the Coefficients table becomes more important because it shows which predictors remain significant when the full model is considered.
The Model Summary table is also important, but it should not be interpreted alone. A model may explain variance overall while some individual predictors are not statistically significant.
SPSS Output for Simple Regression
Simple regression output usually includes three main tables: Model Summary, ANOVA, and Coefficients.
| SPSS Table | What It Shows |
|---|---|
| Model Summary | How much variance is explained |
| ANOVA | Whether the overall model is statistically significant |
| Coefficients | Whether the predictor significantly predicts the outcome |
Model Summary
The Model Summary table includes R and R Square. R Square tells how much variance in the dependent variable is explained by the independent variable.
For example, if R Square is .30, the independent variable explains 30 percent of the variance in the dependent variable.
ANOVA Table
The ANOVA table shows whether the regression model is statistically significant overall. If the significance value is below the selected alpha level, commonly .05, the model is usually considered statistically significant.
Coefficients Table
The Coefficients table shows whether the independent variable significantly predicts the dependent variable.
Important values include:
- Unstandardized B
- Standard error
- Standardized Beta
- t value
- p value
- Confidence interval
The coefficient also shows the direction of the relationship. A positive coefficient means the dependent variable increases as the independent variable increases. A negative coefficient means the dependent variable decreases as the independent variable increases.
SPSS Output for Multiple Regression
Multiple regression output includes similar tables, but interpretation is more detailed because several predictors are included.
| SPSS Table | What It Shows |
|---|---|
| Model Summary | How much variance the full model explains |
| ANOVA | Whether all predictors together significantly predict the outcome |
| Coefficients | Which individual predictors are significant |
| Collinearity Statistics | Whether predictors are too highly related |
Model Summary
The Model Summary table includes R Square and Adjusted R Square. R Square shows the variance explained by all predictors together. Adjusted R Square adjusts the value based on the number of predictors in the model.
Adjusted R Square is often useful because adding more predictors can increase R Square even when the added predictors contribute little practical value.
ANOVA Table
The ANOVA table shows whether the full set of predictors significantly predicts the dependent variable. A significant ANOVA result means the model is statistically significant overall.
However, a significant overall model does not automatically mean every predictor is significant. The Coefficients table must be reviewed to evaluate individual predictors.
Coefficients Table
The Coefficients table shows which predictors are significant after accounting for the other predictors in the model.
Important values include:
- Unstandardized B
- Standard error
- Standardized Beta
- t value
- p value
- Confidence interval
- Tolerance
- VIF
A predictor may be significant when tested alone but may become non significant after other predictors are included. This is one reason multiple regression is useful for dissertation models with several variables.
Assumptions of Simple and Multiple Regression
Regression assumptions help determine whether the results are reliable. Simple and multiple regression share several assumptions, but multiple regression also requires extra attention to multicollinearity.
| Assumption | Simple Regression | Multiple Regression |
|---|---|---|
| Continuous dependent variable | Required | Required |
| Linearity | Required | Required |
| Independence of errors | Required | Required |
| Normality of residuals | Required | Required |
| Homoscedasticity | Required | Required |
| Outlier review | Required | Required |
| Multicollinearity | Not usually relevant | Required |
Linearity
Regression assumes that the relationship between the predictor and outcome is linear. In simple regression, this means the one predictor should have a reasonably straight line relationship with the dependent variable. In multiple regression, each predictor should have an appropriate relationship with the outcome.
Independence of Errors
The residuals should be independent. This assumption matters when data points may be related to each other, such as repeated measures, time based observations, or clustered responses.
Normality of Residuals
Regression assumes that residuals are approximately normally distributed. In SPSS, this is often checked using histograms, normal P P plots, or standardized residuals.
Homoscedasticity
Homoscedasticity means that the residuals should have a consistent spread across predicted values. This is often checked using residual scatterplots.
Outliers
Outliers can distort regression results and affect coefficients, significance values, and model fit. Standardized residuals, Cook’s distance, leverage values, and casewise diagnostics may be reviewed.
Multicollinearity
Multicollinearity is mainly a concern in multiple regression because several predictors are included. If predictors are too strongly related to each other, the unique effect of each predictor becomes difficult to interpret.
Tolerance and VIF are commonly used in SPSS to check multicollinearity.
How to Interpret Simple Regression Results
Simple regression interpretation focuses on model significance, variance explained, predictor significance, and direction of the relationship.
A complete simple regression interpretation answers these questions:
- Was the model statistically significant?
- How much variance did the predictor explain?
- Was the independent variable a significant predictor?
- Was the relationship positive or negative?
- Was the hypothesis supported?
Example interpretation:
A simple linear regression was conducted to examine whether study time predicted academic performance. The regression model was statistically significant, indicating that study time significantly predicted academic performance. The R Square value showed the proportion of variance in academic performance explained by study time. The coefficient showed the direction and strength of the relationship.
A strong regression interpretation connects the statistical result directly to the research question, the hypothesis, and the meaning of the predictor.
How to Interpret Multiple Regression Results
Multiple regression interpretation includes both the full model and the individual predictors.
A complete multiple regression interpretation answers these questions:
- Was the full model statistically significant?
- How much variance did all predictors explain together?
- What was the Adjusted R Square?
- Which predictors were statistically significant?
- Which predictors were not significant?
- Which predictor had the strongest effect?
- Was multicollinearity acceptable?
- Were the hypotheses supported?
Example interpretation:
A multiple linear regression was conducted to examine whether study time, attendance, and motivation predicted academic performance. The overall model was statistically significant, indicating that the predictors collectively explained a significant amount of variance in academic performance. The Adjusted R Square value showed the proportion of variance explained after accounting for the number of predictors. The coefficients table showed which predictors made significant unique contributions to the model.
A strong multiple regression interpretation separates the overall model result from the individual predictor results. This helps show whether the full model is useful and which variables contributed most clearly to the outcome.
For results writing support, visit Dissertation Results Help.
How to Report Simple Regression in a Dissertation
A dissertation write up for simple regression should explain why the test was used, which variables were included, whether assumptions were checked, and what the results mean.
A strong simple regression report includes:
- Purpose of the analysis
- Dependent variable
- Independent variable
- Assumption testing summary
- R Square
- ANOVA result
- Coefficient result
- Hypothesis decision
- Plain language interpretation
Example report structure:
A simple linear regression was used to determine whether [independent variable] predicted [dependent variable]. The assumptions of linear regression were checked before interpreting the results. The regression model was [significant/not significant]. The model explained [R Square value] of the variance in [dependent variable]. The coefficient for [independent variable] indicated that [interpret direction and significance]. Therefore, the hypothesis was [supported/not supported].
How to Report Multiple Regression in a Dissertation
A dissertation write up for multiple regression is usually longer because the model includes several predictors.
A strong multiple regression report includes:
- Purpose of the analysis
- Dependent variable
- Independent variables
- Assumption testing results
- Multicollinearity results
- R Square and Adjusted R Square
- ANOVA result
- Coefficients result
- Significant predictors
- Non significant predictors
- Hypothesis decisions
- Plain language conclusion
Example report structure:
A multiple linear regression was used to determine whether [independent variables] predicted [dependent variable]. The assumptions of multiple regression were checked before interpreting the results. The overall model was [significant/not significant]. The model explained [R Square or Adjusted R Square value] of the variance in [dependent variable]. The coefficients table showed that [predictor names] were significant predictors, while [predictor names] were not significant predictors. Based on these results, the hypotheses were [supported/not supported].
Simple Regression vs Multiple Regression: Which Is Better?
Neither simple regression nor multiple regression is automatically better. The better method is the one that matches the research question and variable structure.
Simple regression is better when the study has one predictor and one continuous outcome. Multiple regression is better when the study has several predictors and one continuous outcome.
A simple model can be strong when it directly answers the research question. A multiple model can be strong when the predictors are supported by theory and the model is interpreted properly.
The goal is not to choose the most advanced method. The goal is to choose the most appropriate method.
Common Mistakes Students Make
Using Multiple Regression Only Because It Looks Advanced
Multiple regression should only be used when the study has several predictors. A model should not include extra variables unless they are supported by the research question, literature, or theory.
Using Simple Regression When the Study Has Several Predictors
If the research question includes several independent variables, simple regression may not answer the full question. Multiple regression is usually more suitable when several predictors are tested together.
Running Separate Simple Regressions Instead of One Multiple Regression
Separate simple regressions do not show the unique effect of each predictor after controlling for the others. When the research question involves several predictors working together, one multiple regression model is usually more suitable.
Ignoring the Dependent Variable Type
Simple and multiple linear regression usually require a continuous dependent variable. If the dependent variable is ordinal, binary, or categorical, another regression method may be more appropriate.
Ignoring Assumptions
Regression assumptions should be checked before interpreting the output. Ignoring assumptions can weaken the validity of the results.
Forgetting Multicollinearity in Multiple Regression
Multiple regression requires checking whether independent variables are too highly related. Severe multicollinearity can make coefficients unstable and difficult to interpret.
Adding Too Many Predictors
Adding many predictors does not automatically improve the model. Each predictor should have a clear reason for being included.
Reporting Results Without Explaining Meaning
A strong dissertation write up should explain what the statistical results mean in relation to the research question and hypotheses.
Related Note: When Simple or Multiple Linear Regression Is Not Enough
Simple and multiple regression are most suitable when the dependent variable is continuous. If the dependent variable is ordinal, binary, or categorical, another regression method may be needed.
For example, if the dependent variable is satisfaction level measured as low, medium, and high, ordinal regression may be more suitable. If the dependent variable is yes or no, logistic regression may be more suitable.
For ordinal outcomes, visit How to Do Ordinal Regression in SPSS.
For binary outcomes, visit Logistic Regression in SPSS.
How SPSSDissertationHelp Can Help
At SPSS Dissertation Help, students and researchers can get support with choosing, running, interpreting, and reporting regression analysis for dissertations, theses, assignments, journal papers, and research projects.
Support may include:
- Reviewing research questions and hypotheses
- Choosing between simple regression and multiple regression
- Checking whether the dependent variable is suitable
- Cleaning and screening the SPSS dataset
- Running regression analysis in SPSS
- Checking regression assumptions
- Interpreting Model Summary, ANOVA, and Coefficients tables
- Checking multicollinearity for multiple regression
- Writing dissertation ready results
- Explaining findings in clear academic language
Before running the wrong model or submitting incomplete results, send your variables, research questions, or SPSS output for review.
Final Thoughts
Simple regression and multiple regression are closely related, but they are used for different research situations.
Simple regression is used when one independent variable predicts one dependent variable. Multiple regression is used when two or more independent variables predict one dependent variable.
In SPSS, both methods may be accessed through the same Linear Regression menu, but the model changes based on the number of predictors entered. Simple regression is easier to interpret because there is only one predictor. Multiple regression is more detailed because it evaluates several predictors at the same time and requires extra attention to multicollinearity.
For dissertation research, the correct choice depends on the research question, hypotheses, number of independent variables, dependent variable type, and theoretical framework. The best analysis is not the most complicated one. It is the one that accurately answers the research question and can be defended clearly in the methodology and results chapters.
Need help choosing between simple and multiple regression in SPSS? Request Quote Now
FAQ
The main difference is the number of independent variables. Simple regression uses one independent variable to predict one dependent variable. Multiple regression uses two or more independent variables to predict one dependent variable.
Simple regression is often called simple linear regression when one independent variable is used to predict one continuous dependent variable using a linear model. Linear regression can be simple or multiple depending on the number of predictors.
Multiple regression often refers to multiple linear regression when two or more independent variables are used to predict one continuous dependent variable. Other types of regression may be needed for non continuous outcomes.
Simple regression should be used when there is one continuous dependent variable and one independent variable. It is appropriate when the research question asks whether one predictor explains or predicts an outcome.
Multiple regression should be used when there is one continuous dependent variable and two or more independent variables. It is appropriate when the research question includes several predictors or control variables.
Neither is automatically better. Simple regression is better for one predictor models. Multiple regression is better for models with several predictors. The correct choice depends on the research question and variables.
No. If there is only one independent variable, the model is simple regression, not multiple regression.
No. If several independent variables predict one dependent variable, the correct model is multiple regression.
Separate simple regressions can show whether each predictor individually relates to the outcome, but they do not show the unique effect of each predictor after controlling for the others. If the research question includes several predictors in one model, multiple regression is usually more appropriate.
A predictor may be significant in simple regression but non significant in multiple regression because other predictors explain some of the same variance. This often happens when independent variables are related to each other.
The main assumptions include linearity, independence of errors, normality of residuals, homoscedasticity, and outliers.
The main assumptions include linearity, independence of errors, normality of residuals, homoscedasticity, outliers, and multicollinearity.
R Square shows how much variance in the dependent variable is explained by the independent variable.
Adjusted R Square shows how much variance is explained after adjusting for the number of predictors in the model. It is especially useful in multiple regression.
Multicollinearity occurs when predictors are too highly related to each other. It can make regression coefficients unstable and difficult to interpret.
The Model Summary, ANOVA, and Coefficients tables are all important. In simple regression, the Coefficients table shows whether the predictor is significant. In multiple regression, the Coefficients table also shows which predictors remain significant after the others are included.
Yes. SPSSDissertationHelp can help with choosing the correct regression model, running the analysis in SPSS, checking assumptions, interpreting output, and writing dissertation ready results. Start here: Request Quote Now.