How to Perform Paired Samples t-Test in SPSS
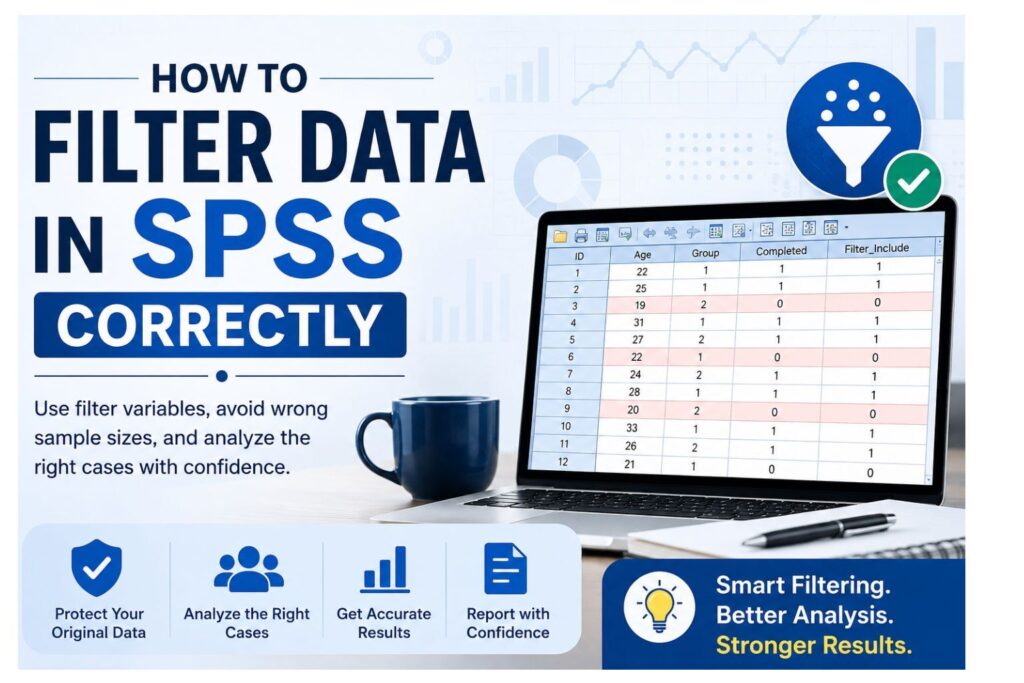
A paired samples t-test in SPSS is one of the most useful statistical procedures for researchers who need to compare two related measurements from the same participants. It is widely used in dissertations, theses, journal articles, and project reports because many real research questions focus on change. A researcher may want to know whether students improved after a training session, whether patients showed lower symptom scores after treatment, or whether employee productivity increased after a new process was introduced. In all of these situations, the same people are measured twice, which makes the paired samples t-test the correct method.
This guide explains how to perform a paired samples t-test in SPSS step by step, when to use it, what assumptions must be checked, how to read the SPSS output, and how to report the result in an academic way. The goal is not only to help you run the test, but also to help you understand it well enough to write a strong dissertation results chapter. At spssdissertationhelp.com, that matters because many students can click through the SPSS menu but still struggle to justify the test, interpret the tables, or explain the meaning of the result in plain research language.
What Is a Paired Samples t-Test?
A paired samples t-test is a parametric test that compares the means of two related measurements. The word paired is important because it tells you that the observations are linked. In most cases, that means the same participants provide both scores. The test works by calculating the difference between the first and second score for every participant and then testing whether the average of those differences is significantly different from zero.
This makes the paired samples t-test ideal for before-and-after studies, repeated measures designs with two time points, and matched designs where observations are naturally linked. For example, if a researcher measures depression scores before therapy and after therapy, each participant has two connected values. The analysis does not treat those scores as independent. Instead, it asks whether the change within participants is large enough that it is unlikely to have happened by chance.
Researchers often choose this method because it is simple, powerful, and directly aligned with many dissertation research questions. A paired samples t-test has wide application across many research fields. In education, researchers use it to evaluate whether an intervention improves academic performance. Nursing and public health studies often apply it to measure changes in patient knowledge after health education programs. Psychology researchers use it to compare stress levels before and after counseling, while business studies may use it to assess whether customer satisfaction improves after a new service strategy. Because it focuses on within-subject change, it is often more efficient than an independent groups design.
When Should You Use a Paired Samples t-Test in SPSS?
You should use a paired samples t-test when your research includes exactly two related observations for each case. The most common situation is a pre-test and post-test design. Another common use is repeated measures with two occasions, such as measuring confidence levels at the start and end of a program. It can also be used when two measurements are matched in a meaningful way, such as comparing the left and right sides of the same patient, or comparing scores from matched pairs in specialized research designs.
The easiest way to decide is to ask one question: do these two scores belong together? If the answer is yes, then the paired samples t-test may be correct. If the answer is no, and the data come from different people in different groups, then the paired test is not appropriate. Many students choose the wrong test because they focus only on the number of columns in SPSS rather than on the design of the study. Good statistical practice begins with the research design, not with the software menu.
A good paired test page should also guide readers toward related support pages without repeating the same keyword excessively. That is where carefully placed internal link anchors help. A reader working on this test may also need SPSS data analysis help, dissertation statistics help, or hypothesis testing in SPSS. Bolding these related terms as internal link opportunities strengthens site structure while keeping the content focused on the paired test itself.
Why the Paired Samples t-Test Matters in Dissertation Research
Many dissertation topics involve intervention, change, progress, recovery, improvement, or response to treatment. These are exactly the kinds of questions a paired comparison can answer. Because the same participants are measured twice, the test accounts for the natural link between the two observations. That makes it highly practical for applied research across health sciences, education, social sciences, management, and psychology.
The problem is that many students treat this test as easy simply because SPSS makes it look easy. In reality, the quality of a dissertation chapter depends on much more than clicking the correct option. A good analysis requires correct test selection, clean data setup, awareness of assumptions, careful interpretation, and professional reporting. Supervisors often comment not because the test is wrong, but because the explanation is weak. Students may paste raw SPSS tables into the document without explaining which table matters most, what the mean difference shows, or why the sign of the difference is negative. These are avoidable problems when the method is properly understood.
This is also why strong SEO content should do more than chase search terms. It should solve the reader’s real problem. For this topic, the real problem is not just how to click the menu path. It is how to move from research question to test selection to output interpretation to polished results writing. Content that handles all of those stages is more likely to perform well for both users and search engines.
Assumptions of the Paired Samples t-Test
Before running a paired samples t-test in SPSS, researchers should check that the test assumptions are reasonably met. This is especially important in dissertations because supervisors often expect justification for the chosen method.
First, the dependent variable should be continuous, meaning it is measured at interval or ratio level, or treated as scale in SPSS. Common examples include test scores, blood pressure, anxiety scores, and reaction times.
Second, the observations must be paired. This means each participant provides two related scores, such as before-and-after measurements, or the data come from matched cases. If the observations are unrelated, the paired t-test is not appropriate.
Third, the difference scores should be approximately normally distributed. The test does not require each variable to be perfectly normal. Instead, researchers should assess the distribution of the difference scores using tools such as a histogram, Q-Q plot, or Shapiro-Wilk test.
Fourth, there should be no serious outliers in the difference scores, since extreme values can distort the result.
Finally, the study design and data quality should be sound, because statistical software cannot correct weak research design.
When these assumptions are not met, researchers may need a nonparametric alternative such as the Wilcoxon Signed-Rank Test in SPSS. Including this distinction improves the usefulness of the page and helps readers who are uncertain whether the paired t-test is suitable for their data.
How to Prepare the Data in SPSS
A paired samples t-test requires a simple but specific data structure. Each row should represent one participant or one matched case. Each column should represent one of the two related measurements. For example, a study on student performance might include one column called Pre_Test and another called Post_Test. A study on stress might use Stress_Before and Stress_After. The important thing is that both scores for the same participant appear on the same row.
A basic data structure looks like this:
| Participant | Pre_Test | Post_Test |
|---|---|---|
| 1 | 54 | 61 |
| 2 | 48 | 53 |
| 3 | 60 | 67 |
| 4 | 57 | 62 |
| 5 | 50 | 58 |
Researchers should check for missing values before running the test. If a participant has only one of the two scores, that case will not contribute fully to the paired analysis. SPSS generally excludes incomplete pairs automatically. It is also important to label variables clearly so that the correct order can be selected in the dialog box. Clear labels reduce the chance of reversing the variables and then struggling to interpret the direction of the mean difference later.
Data screening also matters. Look for impossible values, miscoded entries, or duplicate cases. Even a simple test deserves careful preparation. Readers searching for this topic often also need SPSS Descriptive Statistics or data cleaning in SPSS, so these can serve as relevant supporting internal links elsewhere on the site.
Step by Step: How to Perform a Paired Samples t-Test in SPSS
Running the test in SPSS is straightforward once the data are structured correctly. The steps below are the exact process most students use.
Open your dataset in SPSS and confirm that the two related variables are present in separate columns. Make sure each case has both values recorded in the same row.
From the top menu, click Analyze. Then move to Compare Means. From the options that appear, select Paired-Samples T Test. SPSS will open a dialog box where you can define the two related variables.
Select your first variable, such as Pre_Test, and place it into the first side of the pair. Then select the second variable, such as Post_Test, and place it into the second side of the pair. SPSS will now treat them as a matched pair.
Click Options if you want to adjust the confidence interval. In most research settings, the default 95 percent confidence interval is appropriate and should usually be left unchanged unless your methodology justifies another level.
After checking the variable pair, click OK. SPSS will produce the output in the Output Viewer.
The software usually provides three main tables. The first is Paired Samples Statistics, which shows the means and standard deviations for each variable. The second is Paired Samples Correlations, which shows the relationship between the two measures. The third is Paired Samples Test, which is the key inferential table. This final table contains the t-statistic, degrees of freedom, confidence interval, mean difference, and significance value.
How to Check Assumptions in Practice
Although the paired samples t-test itself is simple to run, researchers should document that they checked assumptions. In SPSS, this can be done by first creating a difference variable. Go to Transform, then Compute Variable, and create a new variable such as Diff_Score = Pre_Test – Post_Test. Once the difference variable is created, you can inspect its distribution.
Use Analyze, then Descriptive Statistics, then Explore to generate a histogram, normality plot, and boxplot for the difference variable. If the histogram is roughly symmetric, the Q-Q plot does not show dramatic deviation, and there are no serious outliers in the boxplot, the assumption profile is generally acceptable. In formal writing, you do not need to overstate perfection. A simple sentence such as “The distribution of difference scores was inspected and appeared sufficiently normal for parametric analysis” is often enough unless your supervisor requires more detail.
Students who are unsure how to write this section often also search for assumptions of t-test in SPSS or APA results writing, so a strong blog can quietly support those related needs while staying centered on the paired samples method.
Example Research Scenario
Imagine a researcher studying whether a study-skills workshop improves exam performance among university students. Thirty students take a test before the workshop and the same test after the workshop. The two scores are clearly related because both belong to the same students. The research question is whether the average score after the workshop is significantly different from the average score before the workshop.
This is a classic paired samples t-test situation. It is not an independent groups design because there are not two separate groups of students. It is not a one-sample problem because the mean is not being compared to a known fixed benchmark. The paired test directly answers the change question.
The next part explains how SPSS presents the results, how to read each output table, how to create a clean dissertation-style table, and how to report the findings in formal academic language.
Once the paired samples t-test has been run in SPSS, the next task is interpretation. This is the stage where many students lose marks because they either describe too little, describe the wrong values, or paste the software tables directly into the dissertation without explaining what they mean. A strong results section should be selective, accurate, and easy to read. It should guide the reader from descriptive information to statistical conclusion without sounding mechanical.
The good news is that SPSS presents this test in a fairly consistent way. Most output includes a descriptive table, a correlation table, and the main paired samples test table. When you know which table matters most, interpretation becomes much easier.
Paired Samples Statistics Table
The first table SPSS produces usually looks like this:
| Variable | Mean | N | Std. Deviation | Std. Error Mean |
|---|---|---|---|---|
| Pre-Test Score | 58.40 | 30 | 10.25 | 1.87 |
| Post-Test Score | 64.90 | 30 | 9.80 | 1.79 |
This table provides descriptive statistics for the two related measurements. It tells you the average score in each condition, how many valid paired cases were included, how much variation there was in each set of scores, and the standard error of each mean. At this stage, you can already see the direction of change. In this example, the post-test mean is higher than the pre-test mean, which suggests improvement.
However, this table does not tell you whether the difference is statistically significant. It only describes the two sets of scores. That distinction is important. Many inexperienced writers stop here and claim there was an improvement simply because one mean is larger than the other. In research reporting, descriptive differences are not enough. Statistical testing is what tells you whether the observed change is likely to reflect a real pattern rather than random variation.
Paired Samples Correlations Table
SPSS usually follows the descriptive table with a correlation table.
| Pair | N | Correlation | Sig. |
|---|---|---|---|
| Pre-Test & Post-Test | 30 | .72 | .000 |
This table shows the correlation between the two related measurements. In the example above, the correlation is positive and fairly strong, which means students who scored higher before the intervention also tended to score higher after the intervention. This information can be useful for understanding the relationship between the two measures, but it is not the main answer to the research question.
In many dissertations, the correlation table is mentioned briefly or omitted from the final written report unless the supervisor expects complete output commentary. The central table for the paired samples t-test is the next one. That is where the actual significance test appears.
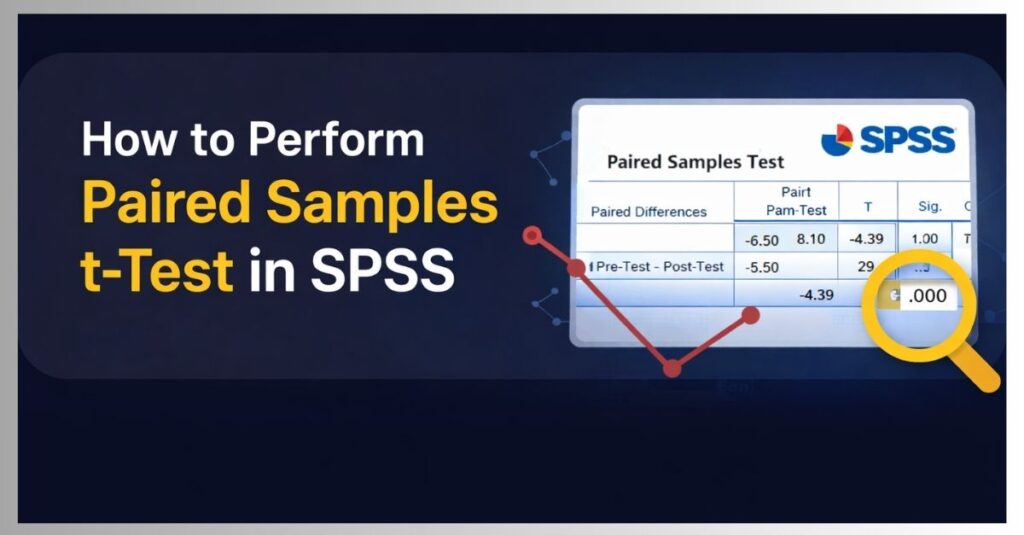
Paired Samples Test Table
The main inferential table in SPSS usually looks like this:
| Pair | Mean Difference | Std. Deviation | Std. Error Mean | 95% CI Lower | 95% CI Upper | t | df | Sig. (2-tailed) |
|---|---|---|---|---|---|---|---|---|
| Pre-Test – Post-Test | -6.50 | 8.10 | 1.48 | -9.53 | -3.47 | -4.39 | 29 | .000 |
This is the most important table in the output because it answers the core question. Did the mean difference between the two related scores reach statistical significance? In this example, the answer is yes.
The mean difference is -6.50. The negative sign does not mean the result is bad. It simply reflects the order of subtraction. Because SPSS calculated Pre-Test minus Post-Test, and the post-test scores were higher, the result is negative. If the variables had been entered in the opposite order, the sign would be positive.
The standard deviation of the difference scores is 8.10, which shows how much participants varied in the amount of change they experienced. The standard error mean is 1.48, which reflects the precision of the estimated mean difference.
The confidence interval ranges from -9.53 to -3.47. Since this interval does not include zero, it supports the conclusion that the true average difference is unlikely to be zero.
The test statistic is t = -4.39 with 29 degrees of freedom. The significance value shown by SPSS is .000, but this should never be reported as p = .000 in academic writing. The correct format is p < .001.
Because the p-value is below .05, the result is statistically significant. That means the difference between the pre-test and post-test scores is unlikely to be due to chance alone. In the example, the workshop appears to have significantly improved performance.
How to Write the Results in Academic Language
A results paragraph should not sound like software output copied into prose. It should sound like a researcher explaining the findings. A clear interpretation for the example above could read as follows:
A paired samples t-test was conducted to determine whether students’ performance changed after the study-skills workshop. The results showed that post-test scores were significantly higher than pre-test scores. Students scored lower before the workshop (M = 58.40, SD = 10.25) than after the workshop (M = 64.90, SD = 9.80), and this difference was statistically significant, t(29) = -4.39, p < .001. These findings suggest that the workshop was associated with improved academic performance.
This style works well because it includes the purpose of the test, the descriptive statistics, the inferential result, and a direct substantive interpretation. It is formal enough for a dissertation but still easy to read.
A Clean Dissertation Table for Reporting
Instead of copying the full SPSS output, many researchers present a simplified summary table in the results chapter. That approach looks more professional and keeps the focus on the most meaningful values.
| Measure | Pre-Test M (SD) | Post-Test M (SD) | Mean Difference | t(df) | p-value |
|---|---|---|---|---|---|
| Performance Score | 58.40 (10.25) | 64.90 (9.80) | -6.50 | -4.39 (29) | < .001 |
This kind of table is cleaner than raw SPSS screenshots and easier for examiners to scan. It also fits well with wider dissertation reporting styles. Students preparing chapter results often also need APA table formatting, SPSS output interpretation, or Chapter 4 results writing, all of which can be linked naturally from related service or blog pages on the site.
How to Report the Result in APA Style
Many users searching for this topic are not just asking how to run the test. They are also asking how to report it. APA style requires researchers to present the key statistics clearly and concisely. A typical APA sentence would be:
A paired-samples t test showed that participants scored significantly higher after the intervention (M = 64.90, SD = 9.80) than before the intervention (M = 58.40, SD = 10.25), t(29) = -4.39, p < .001.
This format is concise and complete. It does not overload the sentence with unnecessary values, but it includes enough detail for the reader to understand the finding. In some departments, you may also be asked to report a confidence interval or effect size. If that is required, include it consistently across your results section.
Should You Report Effect Size?
Yes, effect size can improve the quality of the report because it addresses the magnitude of the difference, not just its statistical significance. A p-value tells you whether the change is unlikely to be due to chance. Effect size tells you whether the change is small, moderate, or large in practical terms.
For a paired samples t-test, Cohen’s d is often reported, although researchers should calculate the appropriate version for repeated measures data. Including effect size is especially helpful in dissertations where the discussion chapter must explain not only whether a difference exists, but also whether it is meaningful. A statistically significant change in a very large sample can still be trivial in practice. Effect size helps readers judge that issue more carefully.
Common Mistakes to Avoid
A common mistake is using the paired samples t-test when the two groups are actually unrelated. This happens when students see two columns and assume they represent repeated measures, even when the columns really contain scores from two different groups. The correct test depends on the design, not on how many columns appear in SPSS.
Another common error is failing to check assumptions. Even a simple t-test should be supported by basic screening of normality and outliers in the difference scores. Students do not need to write long technical discussions unless required, but they should show awareness that assumptions matter.
A third mistake is misreporting the p-value. SPSS may display .000, but this must be written as p < .001. Reporting p = .000 is incorrect.
A fourth mistake is misunderstanding the sign of the mean difference. Because the sign depends on variable order, it should be interpreted with care. The direction of change is determined by which variable was entered first and which mean is larger.
A fifth mistake is copying raw output tables directly into the dissertation. Clean summary tables and clear narrative paragraphs are almost always better.
A sixth mistake is inconsistency between the table and the text. If the table shows scores increased but the written paragraph claims they decreased, the credibility of the analysis is immediately weakened.
What If the Result Is Not Significant?
Not every paired samples t-test will produce a significant result. If the p-value is greater than .05, the correct interpretation is that there was no statistically significant evidence of a mean difference between the two related measurements. That does not mean the study failed. It means the observed difference was not large enough, given the variability and sample size, to conclude that a real change occurred beyond chance.
A non-significant finding can still be important. It may show that the intervention had limited impact, that the sample was too small to detect a modest effect, or that the timing of measurement was not ideal. In dissertation writing, honesty is more important than forcing significance. Good research explains results accurately and then reflects on their meaning in the discussion chapter.
When to Use a Nonparametric Alternative
If the difference scores are heavily skewed, the sample is very small, or there are serious outliers that cannot be justified, the paired samples t-test may not be the best choice. In those cases, the Wilcoxon Signed-Rank Test in SPSS is often the appropriate nonparametric alternative. This is an important distinction because it helps users make better method choices and strengthens the depth of the blog without turning it into a different keyword page.
A reader who lands on this page may begin with the assumption that a paired t-test is needed, but high-quality SEO content should also help them discover when a different test is more appropriate. That kind of clarity improves trust, reduces bounce, and makes the content genuinely useful.
Why This Blog Structure Is Strong for Search and Users
A page on how to perform a paired samples t-test in SPSS performs best when it satisfies both informational intent and academic intent. Informational intent means the reader wants direct steps, assumptions, output explanation, and examples. Academic intent means the reader also needs reporting guidance, interpretation, and confidence that the explanation is credible enough for dissertation use.
That is why this structure works well. The first part defines the test, explains when to use it, clarifies assumptions, and shows the SPSS steps. The second part interprets the output, provides clean tables, explains APA reporting, and answers practical questions students are likely to search. Together, these sections cover the full journey from method selection to results write-up.
FAQ
What is a paired samples t-test in SPSS?
A paired samples t-test in SPSS is a statistical procedure used to compare two related means. It is commonly used when the same participants are measured twice, such as before and after an intervention.
When should I use a paired samples t-test?
Use it when the two scores are linked in a meaningful way, usually because they come from the same participants at two different times or under two conditions.
What is the difference between a paired samples t-test and an independent samples t-test?
A paired samples t-test compares two related measurements, while an independent samples t-test compares two separate and unrelated groups.
What kind of variables are needed?
The dependent variable should be continuous or treated as scale data in SPSS, and each participant must have two related scores.
What assumptions should be checked?
Researchers should check that the scores are paired, the difference scores are approximately normally distributed, and there are no serious outliers in the differences.
Which SPSS output table is the most important?
The Paired Samples Test table is the key table because it contains the mean difference, t-value, degrees of freedom, confidence interval, and p-value.
Why is the mean difference sometimes negative?
The sign depends on the order in which the variables were entered. A negative mean difference does not automatically mean a negative outcome. It simply reflects which score SPSS subtracted from which.
How do I report the p-value if SPSS shows .000?
You should report it as p < .001, not p = .000.
Do I need to include the correlation table in my dissertation?
Usually not. The correlation table can be informative, but the main focus should be on the descriptive statistics and the Paired Samples Test table unless your department requires full output explanation.
Can I use Likert scale data in a paired samples t-test?
Researchers sometimes use composite Likert-based scale scores as continuous variables, especially when the scale contains multiple items and behaves approximately like interval data. The decision depends on the measurement structure and the assumptions.
What is the nonparametric alternative to a paired samples t-test?
The most common nonparametric alternative is the Wilcoxon Signed-Rank Test in SPSS.
What if the result is not significant?
Then the correct conclusion is that there was no statistically significant evidence of a mean difference between the two related measurements. The result should still be reported honestly and discussed in context.
How do I write the result in APA style?
A common APA format is: A paired-samples t test showed that participants scored significantly higher after the intervention than before the intervention, t(df) = value, p < .05, with means and standard deviations reported for both conditions.
Can this test be used in dissertation research?
Yes. It is widely used in education, psychology, health sciences, nursing, business, and social science dissertations.
Can spssdissertationhelp.com help me interpret my paired t-test output?
Yes. Support can include test selection, assumption checking, output interpretation, APA reporting, table formatting, and dissertation results writing through SPSS data analysis help and dissertation statistics help.
Final Thoughts
A paired samples t-test in SPSS is one of the most practical tools for answering research questions about change. It is simple to run, but strong reporting still requires careful thinking. Researchers need to know when the test is appropriate, how to structure the data, how to check assumptions, how to interpret the output, and how to present the findings in a polished academic style.