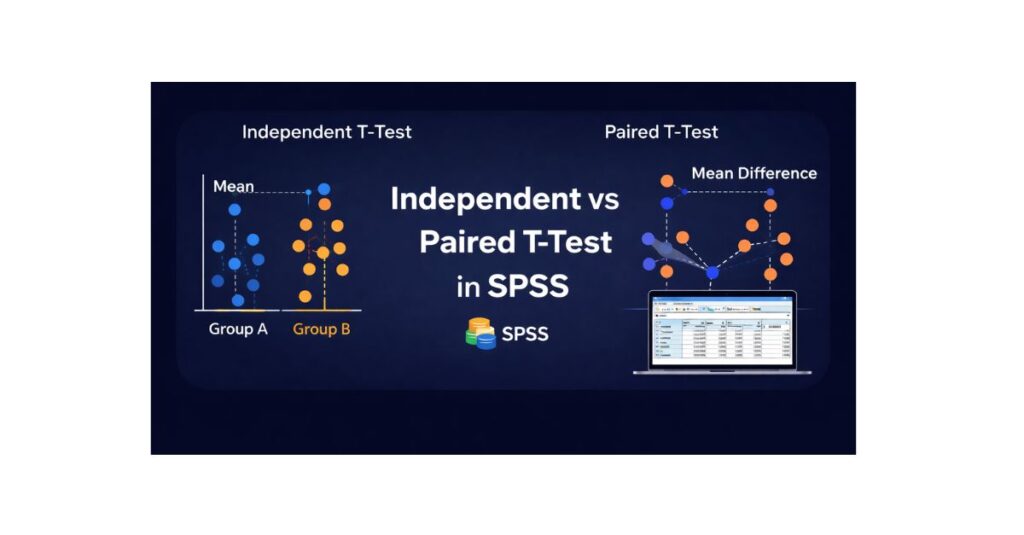
Independent vs Paired T-Test in SPSS: A Complete Guide for Students & Researchers
Independent vs paired t-test in SPSS is one of the most common points of confusion for students working on statistical assignments, theses, and dissertations. Although both tests are used to compare means, choosing the wrong test can lead to incorrect analysis and loss of marks. Understanding the difference between an independent vs paired t-test in SPSS is essential because each test is designed for a specific research design and type of data relationship.
This comprehensive guide explains the independent vs paired t-test in SPSS from both a conceptual and practical perspective. It shows when to use each test, how to run them step by step in SPSS, how to interpret the output correctly, and how to report results in APA style for academic writing. If at any point you need expert guidance, you can visit SPSS Dissertation Help for personalised academic support.
What Is a T-Test in SPSS?
A t-test is a statistical method used to determine whether there is a statistically significant difference between two means. The most important factor in choosing the correct t-test is not the number of variables, but how the observations are related.
In SPSS, the choice is usually between:
- An independent t-test (unrelated groups)
- A paired t-test (related or repeated measurements)
Understanding this distinction is fundamental to accurate SPSS data analysis.
Independent T-Test in SPSS
An independent t-test is used when you want to compare the means of two separate and unrelated groups. Each participant belongs to only one group, and there is no logical pairing between observations.
When Independent T-Tests Are Used
Independent t-tests are common in:
- Psychology (e.g., male vs female participants)
- Business research (e.g., two different companies)
- Education studies (e.g., online vs face-to-face learners)
Key Assumptions
- The dependent variable is continuous
- The independent variable has two independent groups
- Observations are independent
- Data are approximately normally distributed
- Variances are equal across groups
If these assumptions are violated, results may be misleading. Many students choose to Contact Us to verify assumptions before submission.
Paired T-Test in SPSS
A paired t-test (also called a dependent t-test) is used when the same participants are measured twice, or when observations are meaningfully matched.
When Paired T-Tests Are Used
Paired t-tests are ideal for:
- Pre-test vs post-test designs
- Before-and-after intervention studies
- Matched-pair research designs
Instead of comparing group means, the paired t-test focuses on the mean difference within subjects, which increases statistical power.
Independent vs Paired T-Test: Key Differences
| Feature | Independent T-Test | Paired T-Test |
|---|---|---|
| Groups | Two separate groups | One group measured twice |
| Relationship | Unrelated | Related / matched |
| Focus | Difference between group means | Difference within subjects |
| Power | Lower | Higher |
one of the most common statistical errors in student research. If you are unsure, it is strongly recommended to Contact Us before running your analysis.
Step-by-Step: How to Run an Independent T-Test in SPSS
- Open your dataset in SPSS
- Click Analyze → Compare Means → Independent-Samples T Test
- Move the dependent variable to Test Variable(s)
- Move the grouping variable to Grouping Variable
- Define the two groups correctly
- Click OK
SPSS will generate group statistics, Levene’s test, and the t-test results.
Step-by-Step: How to Run a Paired T-Test in SPSS
- Open your dataset in SPSS
- Click Analyze → Compare Means → Paired-Samples T Test
- Select the two related variables (e.g., Pre and Post)
- Move them to Paired Variables
- Click OK
SPSS will calculate the mean difference, t-value, degrees of freedom, and significance.
How to Interpret SPSS T-Test Output
Correct interpretation involves more than reporting a p-value. You should explain:
- The direction of the difference
- The size of the difference
- Statistical significance
- Practical meaning
For deeper understanding, this section should be read alongside Correlation Analysis in SPSS and Regression Analysis in SPSS, as these tests are often used together in dissertations.
APA-Style Result Templates
Independent T-Test (APA)
An independent-samples t-test showed a significant difference between Group A (M = 72.4, SD = 8.6) and Group B (M = 65.1, SD = 9.3), t(58) = 3.12, p = .003.
Paired T-Test (APA)
A paired-samples t-test indicated a significant increase from pre-test (M = 61.8, SD = 7.4) to post-test (M = 70.2, SD = 6.9), t(29) = −4.85, p < .001.
Common Mistakes Students Make
- Using independent t-tests for pre-post designs
- Ignoring assumption checks
- Reporting results without interpretation
- Confusing statistical significance with real-world importance
To avoid these issues, many students rely on SPSS Dissertation Help for result verification and APA-compliant reporting.
Supporting blog posts (e.g., How to Check Normality in SPSS) should link back to this page, strengthening topical authority.
Final Thoughts
The difference between an independent and a paired t-test in SPSS is about research design, not software difficulty. Once you understand whether your observations are independent or related, selecting the correct test becomes straightforward.