

Direct answer: Run Little’s MCAR test in SPSS through Analyze > Missing Value Analysis, select your quantitative variables, and check the EM box under Estimation. The test statistic appears near the “EM Means” output as a chi-square value with degrees of freedom and a significance (p) value. If p ≥ .05, you fail to reject the MCAR assumption; if p < .05, the missingness pattern is likely not completely random.
Instructions and screenshots in this guide reflect the Missing Value Analysis dialog in IBM SPSS Statistics 29, and the same menu path and options apply in versions 27 through 31. If your dialog looks different, see the troubleshooting note in Step 3.
When to Use Little’s MCAR Test
Before you delete cases, impute values, or run analyses on a dataset with gaps, you need some evidence about why those values are missing. Little’s MCAR test gives you a single, formal answer to one narrow question: is there statistical evidence that the missingness is unrelated to any of the variables in your dataset?
That question matters because the missing-data mechanism affects which methods are safe to use later:
- MCAR (Missing Completely at Random): The probability that a value is missing has nothing to do with any observed or unobserved variable. Missingness is essentially noise.
- MAR (Missing at Random): The probability that a value is missing depends on other observed variables in the dataset (for example, younger respondents skip an income question more often), but not on the missing value itself.
- MNAR (Missing Not at Random): The probability that a value is missing depends on the missing value itself (for example, people with the highest incomes are the ones who decline to report income).
Little’s test evaluates evidence against MCAR only. A nonsignificant result is consistent with MCAR, but it cannot confirm MAR or MNAR, and it cannot prove your data are MCAR: it only means the test did not detect a violation. A significant result tells you the data are probably not MCAR, but it does not tell you whether the mechanism is MAR or MNAR.
Before running the test, it’s worth a quick visual check of where the gaps are: Are they concentrated in one variable, one subgroup, or one wave of data collection? Missing Value Analysis reports these patterns alongside the test itself, and reading them together will make the p value easier to interpret.
Step-by-Step: Running Little’s MCAR Test in SPSS
Little’s MCAR test is part of the Missing Values option, which is a separately licensed add-on module in SPSS and is not included in SPSS Statistics Base. If the Missing Value Analysis menu item is grayed out or absent, your license does not include this module (see the troubleshooting note below).
- Open your dataset in the Data Editor and confirm that missing entries are coded as system-missing or as a defined user-missing value (not, for example, left as the text “N/A”).
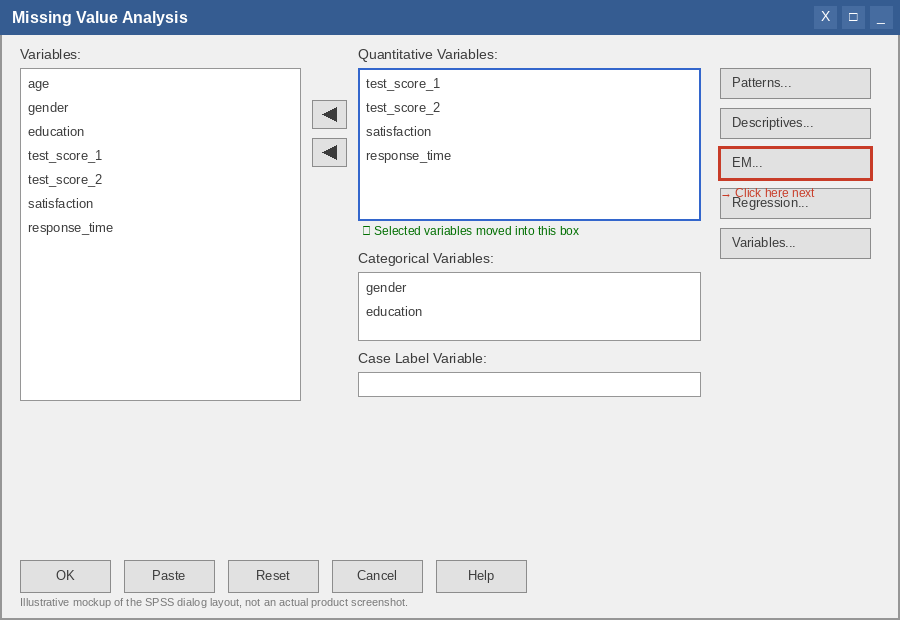
- Go to Analyze > Missing Value Analysis…
- In the Missing Value Analysis dialog, move your quantitative (scale) variables into the Quantitative Variables box. Little’s test requires at least two variables with missing values among the variables you analyze.
- If relevant, move categorical variables into the Categorical Variables box (these are used for describing patterns, not for the EM estimation itself).
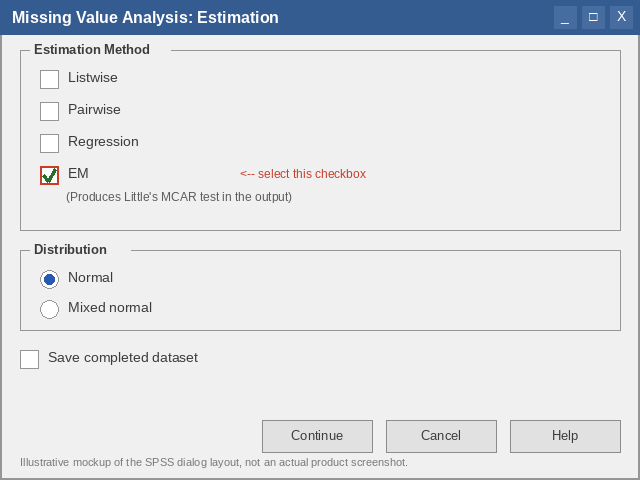
- Click EM… to open the Estimation subdialog, then select the EM checkbox (Estimation method). Leave the default Distribution as Normal unless you have a specific reason to change it, and click Continue.
- Optionally, click Patterns to request tabulated missing-data pattern tables, which help you interpret why the test came out the way it did.
- Click OK to run the procedure.
Where to find the result: In the Viewer, look for the output produced by the EM method. Little’s MCAR test appears as a labeled statistic (reported as a chi-square value, degrees of freedom (df), and a significance value) positioned with the EM Means table in the output. It is easy to scroll past if you’re only looking at the univariate statistics tables higher up in the output, so search the output outline pane for “EM” if you don’t see it immediately.
Troubleshooting: If the Missing Value Analysis menu item doesn’t appear at all, the Missing Values add-on module isn’t licensed on your copy of SPSS; check with your institution’s IT or statistical consulting service about a campus license. If the menu appears but the EM checkbox is disabled, confirm that you have selected at least two quantitative variables and that at least one of them contains missing values; SPSS will not run EM estimation, and therefore will not produce Little’s test, on a dataset with no missing values in the selected variables.
How to Interpret the Output
Little’s MCAR test produces three numbers you need for your write-up: a chi-square statistic, its degrees of freedom, and a p value (labeled “Sig.” in SPSS output).
The null hypothesis (H0) is that the data are missing completely at random. A small p value is evidence against that hypothesis.
Illustrative example only (not a real dataset or finding): Suppose a student runs Little’s MCAR test on five scale variables from a survey with occasional skipped items. The SPSS output reports:
Little’s MCAR test: Chi-Square = 14.271, DF = 18, Sig. = .712
This is a fabricated example used only to demonstrate the reporting format, not a real result.
| p value | Statistical decision | What it suggests |
|---|---|---|
| p ≥ .05 | Fail to reject H0 | No statistical evidence against MCAR; missingness may plausibly be treated as random. This does not prove the data are MCAR. |
| p < .05 | Reject H0 | Evidence that missingness is related to the observed data (or, possibly, to the missing values themselves); MCAR is not a safe assumption. |
Two things worth flagging for a dissertation committee: first, Little’s test has limited statistical power in small samples, so a nonsignificant result in a small dataset is weaker evidence than the same result in a large one. Second, because the test pools information across all selected variables into a single chi-square statistic, it can miss localized MAR patterns involving just one or two variables, which is exactly why examining the missing-data pattern tables alongside the test is worthwhile rather than relying on the p value in isolation.
What to Do Next
The test result is one piece of evidence, not a final verdict. Before choosing how to handle the missing data, weigh the Little’s test result together with:
- The missing-data patterns you tabulated in Missing Value Analysis: is missingness concentrated in a specific variable, timepoint, or subgroup?
- Your study design: was missingness planned (for example, matrix sampling) or incidental (dropout, skipped items)?
- The analysis you intend to run next: some procedures (e.g., full information maximum likelihood, multiple imputation) tolerate MAR data reasonably well, while listwise deletion assumes MCAR.
A nonsignificant Little’s test gives you a defensible basis for using simpler methods like listwise deletion or single imputation. A significant result generally points toward MAR-appropriate techniques such as multiple imputation or full information maximum likelihood. For a full walkthrough of imputation methods, when each is appropriate, and how to implement them in SPSS, see our Data Imputation guide.
How to Report Little’s MCAR Test in APA Style
Both examples below are illustrative and should be replaced with your own output.
Nonsignificant result:
Little’s MCAR test indicated that the data were consistent with a missing completely at random pattern, χ²(18) = 14.27, p = .712.
Significant result:
Little’s MCAR test indicated that the missing data were not consistent with a missing completely at random pattern, χ²(24) = 41.83, p = .014, suggesting that missingness was related to observed values in the dataset.
Frequently Asked Questions
No. A nonsignificant result means the test found no evidence against MCAR; it does not positively confirm the mechanism. Absence of evidence is not evidence of a specific mechanism.
Little’s test itself is computed using the quantitative variables entered for EM estimation. You can include categorical variables in Missing Value Analysis for pattern description, but they are not part of the EM/Little’s test calculation.
This usually means fewer than two quantitative variables are selected, or none of the selected variables contain any missing values. Little’s test needs missing data across multiple variables to compute pattern-based comparisons.
There’s no fixed minimum, but the test is known to have low statistical power in small samples, meaning it can fail to detect a real departure from MCAR when the dataset is small. Interpret a nonsignificant result cautiously in small samples and lean more on the missing-data pattern tables.
It depends on which modules are licensed with that copy, since Missing Value Analysis is part of the separately licensed Missing Values option rather than SPSS Statistics Base. Check your institution’s license or the Help > About dialog for the list of licensed options.
Conclusion
Little’s MCAR test gives you a single, reportable statistic to support (or challenge) the assumption that your missing data are unrelated to the values in your dataset. A nonsignificant result supports treating simple missing-data methods as reasonable; a significant result is a signal to move toward MAR-appropriate techniques and to examine your missing-data patterns more closely before choosing a method. If you’d like help running the test on your own dataset or deciding between imputation methods, our SPSS data cleaning and analysis support team can walk through your output with you.