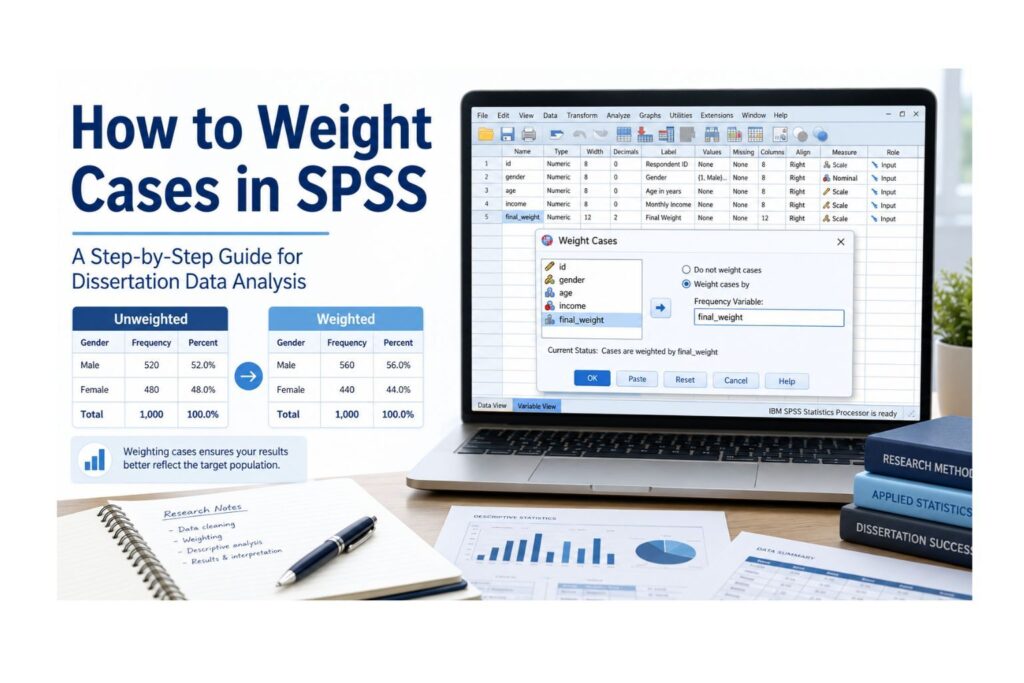
How to Perform Cluster Analysis in SPSS
Cluster analysis is one of the most useful techniques in SPSS for researchers who want to group similar cases or variables into meaningful clusters. If you are trying to understand how to perform cluster analysis in SPSS, the key idea is simple: cluster analysis helps identify natural groupings in the data based on shared characteristics. This makes it especially valuable in dissertations, theses, healthcare studies, business research, psychology projects, education research, and marketing analysis where the goal is to uncover patterns rather than test a traditional hypothesis.
Many students collect large datasets and realize that not all participants or variables are alike. Some individuals may form clear subgroups based on attitudes, behaviors, symptoms, or demographic patterns. In other cases, researchers want to group variables that behave similarly. That is where cluster analysis becomes useful. Instead of comparing one variable at a time, cluster analysis allows the researcher to detect structure in the dataset and organize it into clusters that are easier to interpret.
For spssdissertationhelp, this topic should remain clearly distinct from Factor Analysis in SPSS, PCA in SPSS, and Discriminant Analysis in SPSS so the content stays focused and avoids keyword cannibalization. This page is specifically about how to perform cluster analysis in SPSS, including when to use it, how to prepare the data, what method to choose, the exact steps to follow, and how to interpret the output in a dissertation-friendly way.
What Is Cluster Analysis in SPSS?
Cluster analysis is an exploratory statistical technique used to classify observations or variables into groups called clusters. The goal is to place similar cases in the same cluster while keeping different cases in separate clusters. Unlike regression, ANOVA, or correlation, cluster analysis does not start with a dependent variable. Instead, it looks for structure within the data itself.
In practical terms, cluster analysis can help a researcher identify patient profiles, customer segments, student learning groups, or psychological subtypes. For example, a healthcare researcher may use cluster analysis to group patients with similar symptoms. A business researcher may use it to identify customer segments based on purchase patterns. An education researcher may use it to classify students according to motivation, engagement, and study habits.
This method is particularly useful when the research goal is classification, segmentation, or pattern discovery. Because cluster analysis is exploratory, it often appears in early-stage research, survey analysis, market segmentation, and profile identification studies.
When Should You Use Cluster Analysis?
Cluster analysis is appropriate when your study includes:
- several variables that may reveal hidden groupings
- a goal of classifying cases or variables into clusters
- no single dependent variable driving the model
- a research aim focused on patterns, segmentation, or subgroup discovery
Common examples include:
- grouping customers based on spending behavior and satisfaction
- identifying patient subtypes from symptom scores
- clustering students based on performance, attendance, and motivation
- segmenting employees by engagement, stress, and job satisfaction
- grouping survey respondents according to attitudes or preferences
If your goal is to reduce variables into fewer dimensions, PCA in SPSS may be more appropriate. If your goal is to identify latent structure among items, Factor Analysis in SPSS may be the better fit. If your goal is to predict membership in known groups, Discriminant Analysis in SPSS may be more suitable.
Why Researchers Use Cluster Analysis
One major advantage of cluster analysis is that it helps simplify complex data. In many dissertations, the dataset contains many cases that do not behave in the same way. Rather than treating the sample as one uniform group, cluster analysis helps uncover important subgroups that might otherwise be hidden.
Another strength is that cluster analysis is highly practical. In business research, it supports customer segmentation. In healthcare, it helps identify clinical profiles. In psychology, it can reveal behavioral or emotional patterns. In education, it may highlight different types of learners. These cluster-based insights can guide intervention design, strategy development, and theory building.
Cluster analysis is also useful because it can support later analyses. Once clusters are identified, researchers can compare them using ANOVA Help in SPSS, Chi-Square Test in SPSS, or other methods to see whether the groups differ meaningfully on additional variables.
That said, cluster analysis should not be run mechanically. Many students use SPSS to produce clusters without standardizing variables, checking scales, or thinking carefully about the number of clusters. That leads to unstable results and weak interpretation. A strong cluster analysis requires thoughtful preparation and method choice.
Types of Cluster Analysis in SPSS
SPSS offers more than one clustering method, and the right one depends on the research question and data structure.
Hierarchical Cluster Analysis
Hierarchical clustering builds clusters step by step. It can begin by treating each case as its own cluster and then merging the closest cases until larger clusters are formed. This method is especially useful when the researcher wants a visual structure, such as a dendrogram, to help decide how many clusters to retain.
K-Means Cluster Analysis
K-means clustering requires the researcher to specify the number of clusters in advance. SPSS then assigns cases to the nearest cluster center and updates the solution iteratively. This method works well when the sample is larger and the researcher has a rough idea of how many clusters may exist.
Two-Step Cluster Analysis
Two-step clustering is useful when the dataset includes a mixture of continuous and categorical variables. It is also helpful for larger datasets. SPSS can suggest an optimal number of clusters automatically in many cases.
Each method serves a different purpose, so the choice should be guided by theory, variable type, sample size, and the research goal.
Assumptions and Requirements of Cluster Analysis in SPSS
Cluster analysis does not rely on assumptions in exactly the same way as regression or ANOVA, but there are still important requirements researchers should check before proceeding.
1. Relevant variables
The variables included should be meaningful for the clustering goal. Irrelevant variables can distort the solution and reduce interpretability.
2. Appropriate scale of measurement
Continuous variables are commonly used in hierarchical and k-means clustering. Two-step clustering can handle both continuous and categorical variables.
3. Standardization when needed
If variables are measured on very different scales, standardization is often necessary. Otherwise, variables with larger numeric ranges may dominate the clustering solution.
4. Adequate sample size
Cluster analysis generally works better with larger samples, especially for k-means and two-step methods. Very small samples may produce unstable clusters.
5. Outlier awareness
Extreme outliers can affect distances between cases and distort cluster formation. Researchers should inspect the data and decide whether unusual cases need attention.
6. No severe missing data problems
Missing values should be reviewed and managed before analysis. Incomplete data can weaken or alter the cluster solution.
7. Interpretability of clusters
A statistically produced cluster solution must also make conceptual sense. A solution that cannot be meaningfully explained is not very useful for dissertation reporting.
In research writing, these checks are important because supervisors often want to know why the chosen clustering approach was suitable for the data.
Data Setup for Cluster Analysis in SPSS
Your data should be arranged with:
- one row for each participant or observation
- one column for each clustering variable
A simple example looks like this:
| Participant | Satisfaction | Spending | Visit_Frequency | Loyalty |
|---|---|---|---|---|
| 1 | 4.5 | 220 | 8 | 5 |
| 2 | 3.2 | 90 | 3 | 2 |
| 3 | 4.8 | 260 | 9 | 5 |
| 4 | 2.9 | 70 | 2 | 1 |
In this example, the researcher may want to identify customer clusters based on satisfaction, spending, visit frequency, and loyalty. Before running cluster analysis, make sure the variables are coded correctly, measured consistently, and checked for outliers or missing values. If the variables are on very different scales, standardizing them is often a good step.
How to Perform Hierarchical Cluster Analysis in SPSS
These are the steps the client should follow in SPSS for hierarchical clustering.
Step 1: Open your dataset
Launch SPSS and open the file containing the variables you want to use for clustering.
Step 2: Review variable scales
Check whether the clustering variables are measured on similar scales. If not, consider standardizing them first using z-scores.
Step 3: Open the hierarchical cluster menu
Click Analyze, then Classify, then Hierarchical Cluster.
Step 4: Move variables into the analysis box
Select the variables you want to include and move them into the Variables box.
Step 5: Choose clustering method
Under Method, choose the linkage approach. Ward’s method is often popular because it tends to create balanced clusters. You should also choose a distance measure, such as squared Euclidean distance for continuous data.
Step 6: Request plots
Click Plots and select Dendrogram. This is important because the dendrogram helps you decide how many clusters may exist.
Step 7: Request statistics
Under Statistics, request relevant information such as agglomeration schedule if needed.
Step 8: Run the analysis
Click OK. SPSS will generate the output, including the dendrogram and cluster schedule.
Request Quote Now
How to Perform K-Means Cluster Analysis in SPSS
These are the steps the client should follow in SPSS for k-means clustering.
Step 1: Open your dataset
Make sure your variables are ready and standardized if appropriate.
Step 2: Open the k-means menu
Click Analyze, then Classify, then K-Means Cluster.
Step 3: Move variables into the analysis box
Select the variables you want to use and move them into the Variables box.
Step 4: Specify the number of clusters
Enter the number of clusters you want SPSS to create. Researchers often decide this after reviewing a hierarchical solution first.
Step 5: Save cluster membership if needed
If you want to use the cluster groups in later analysis, request that SPSS save cluster membership as a new variable.
Step 6: Request ANOVA table
SPSS can display an ANOVA table showing how strongly the variables differ across clusters. This table is helpful for interpretation, though it is descriptive in the clustering context.
Step 7: Run the analysis
Click OK. SPSS will assign cases to clusters and provide the final cluster centers and related output.
How to Perform Two-Step Cluster Analysis in SPSS
Two-step clustering is useful when the researcher has a mixture of variable types or a larger sample.
Step 1: Open the dataset
Ensure both continuous and categorical variables are coded properly.
Step 2: Open the two-step menu
Click Analyze, then Classify, then TwoStep Cluster.
Step 3: Select variables
Move the relevant variables into the analysis area.
Step 4: Choose cluster options
You can allow SPSS to determine the number of clusters automatically or specify the number manually.
Step 5: Request output
Review the importance of variables, cluster sizes, and model summary.
Step 6: Run the analysis
Click OK and review the cluster solution SPSS provides.
How to Decide the Number of Clusters
One of the most important decisions in cluster analysis is determining how many clusters to retain. This should never be based only on guesswork.
Dendrogram
In hierarchical cluster analysis, the dendrogram helps show where large jumps in cluster fusion occur. Researchers often inspect this visual pattern to identify a sensible number of clusters.
Agglomeration Schedule
Large changes in coefficients may suggest that very different clusters are being forced together. This can help indicate where to stop merging.
Theoretical Meaning
The final clusters should make sense conceptually. A solution with too many clusters may be hard to explain, while too few clusters may oversimplify the data.
Cluster Size Balance
Very tiny clusters may not be useful unless they are theoretically important. Researchers should look for a solution that is interpretable and reasonably balanced.
Replication Across Methods
Some researchers use hierarchical clustering first to estimate the likely number of clusters and then apply k-means clustering with that number for a more stable final solution.
In dissertation reporting, it is best to explain clearly how the chosen number of clusters was determined.
Key SPSS Output Tables to Interpret
SPSS produces different outputs depending on the clustering method, but several tables and figures are especially important.
Dendrogram
This is one of the most important outputs in hierarchical clustering. It visually shows how cases or variables merge into clusters.
Agglomeration Schedule
This table shows the sequence of cluster mergers and helps identify sharp increases that may signal a good stopping point.
Cluster Membership
This output shows which case belongs to which cluster. It is essential for later analysis and interpretation.
Final Cluster Centers
In k-means clustering, this table shows the mean score for each variable in each cluster. It helps define the nature of each group.
Number of Cases in Each Cluster
This table shows cluster sizes, which helps assess whether the solution is practical and balanced.
Predictor Importance
In two-step clustering, SPSS often reports the importance of each variable in forming the clusters. This helps interpret the drivers of group separation.
Example of a Cluster Analysis Output Table
Final Cluster Centers
| Variable | Cluster 1 | Cluster 2 | Cluster 3 |
|---|---|---|---|
| Satisfaction | 4.7 | 3.1 | 2.4 |
| Spending | 240 | 120 | 65 |
| Visit_Frequency | 8 | 5 | 2 |
| Loyalty | 5 | 3 | 1 |
This example suggests that Cluster 1 may represent highly loyal, high-spending customers with strong satisfaction. Cluster 2 may represent moderate customers, while Cluster 3 may represent low-engagement customers.
Number of Cases in Each Cluster
| Cluster | Number of Cases |
|---|---|
| 1 | 48 |
| 2 | 67 |
| 3 | 35 |
This shows the relative size of each cluster and helps determine whether the solution is balanced enough to interpret meaningfully.
How to Interpret Cluster Analysis Results
Suppose a researcher runs k-means cluster analysis on customer behavior variables and obtains three clusters. A clear interpretation could read:
Cluster analysis was conducted using satisfaction, spending, visit frequency, and loyalty scores. A three-cluster solution was retained based on the earlier hierarchical clustering results and conceptual interpretability. The first cluster consisted of highly satisfied, high-spending, and loyal customers. The second cluster reflected moderate customers with average scores across the variables. The third cluster represented low-engagement customers with lower satisfaction, spending, visit frequency, and loyalty. These findings suggest that the sample contains distinct customer segments that may require different strategies.
This kind of interpretation works well in dissertations because it combines statistical results with substantive meaning. The goal is not just to say that three clusters were found, but to explain what makes each group different.
How to Report Cluster Analysis in APA Style
A concise APA-style example is:
A cluster analysis was conducted using satisfaction, spending, visit frequency, and loyalty. Inspection of the hierarchical dendrogram and agglomeration schedule suggested a three-cluster solution. K-means cluster analysis was then performed to refine the classification. The final solution identified three distinct groups: a high-engagement cluster, a moderate-engagement cluster, and a low-engagement cluster. The clusters differed clearly on satisfaction, spending, visit frequency, and loyalty.
If required, you can follow this with a table showing cluster centers and sizes.
Common Mistakes to Avoid
Many students lose marks because of avoidable cluster analysis errors. These include:
- including irrelevant variables in the cluster solution
- failing to standardize variables measured on very different scales
- choosing the number of clusters without justification
- ignoring outliers that distort cluster formation
- interpreting clusters without describing their defining characteristics
- using too many clusters that are hard to explain
- confusing cluster analysis with Factor Analysis in SPSS
- failing to save or use cluster membership for later comparisons
When Cluster Analysis Is Better Than PCA or Factor Analysis
Cluster analysis is better when the goal is to group cases or variables into clusters based on similarity. It is especially useful when the researcher wants to identify profiles, segments, or subgroups.
PCA and factor analysis are more suitable when the goal is data reduction or uncovering dimensions among variables rather than grouping participants. This distinction is important both for research accuracy and for SEO clarity. Someone searching for how to perform cluster analysis in SPSS usually wants to learn how to identify and interpret groups, not how to extract components.
Final Practical Checklist for Clients
Before running cluster analysis in SPSS, the client should confirm all of the following:
- I have selected variables that are meaningful for clustering
- My variables are coded correctly and measured consistently
- I checked for missing data and extreme outliers
- I standardized variables if they are on very different scales
- I chose the clustering method that matches my data and goal
- I have a clear reason for the number of clusters retained
- I reviewed cluster sizes and cluster centers carefully
- I can explain the meaning of each cluster in simple research language
FAQ
What does cluster analysis do in SPSS?
Cluster analysis groups similar cases or variables into clusters based on shared characteristics.
What is the difference between hierarchical and k-means cluster analysis?
Hierarchical clustering builds clusters step by step and is useful for exploring structure, while k-means clustering assigns cases into a fixed number of clusters chosen in advance.
When should I use two-step cluster analysis?
Two-step clustering is useful when you have both continuous and categorical variables or when the dataset is relatively large.
Do I need to standardize variables before cluster analysis?
Often yes, especially when variables are measured on very different scales. Standardization helps prevent one variable from dominating the solution.
How do I choose the number of clusters?
Researchers usually consider the dendrogram, agglomeration schedule, theoretical meaning, and cluster size balance.
Can cluster analysis be used in dissertation research?
Yes. Cluster analysis is widely used in business, healthcare, psychology, education, and social science dissertations.
Is cluster analysis exploratory or confirmatory?
Cluster analysis is mainly exploratory because it looks for natural groupings in the data rather than testing a fixed hypothesis.
Can spssdissertationhelp help with cluster analysis output?
Yes. We can help with SPSS dissertation help, variable selection, output interpretation, APA reporting, and dissertation results writing.
Conclusion
If you want to learn how to perform cluster analysis in SPSS correctly, the key is to think beyond the menu path. A strong cluster analysis requires good variable selection, careful data preparation, the right clustering method, a justified decision on the number of clusters, and clear interpretation of what each cluster represents. When explained well, cluster analysis can strengthen a dissertation by revealing meaningful patterns that are hidden within complex data. For students and researchers who need accurate support, this topic fits naturally within the wider services offered by spssdissertationhelp.