Weighting cases in SPSS can be confusing when your output suddenly shows a different sample size, decimal weighted counts, changed percentages, or a weighted frequency table that does not match the raw dataset. Many students panic when their SPSS weighted N becomes larger than the actual number of participants, or when their supervisor asks why weighted and unweighted results are different.
If you are working on a dissertation, thesis, research project, or survey analysis, learning how to weight cases in SPSS is important. Weighting may be required when your dataset contains frequency counts, official survey weights, grouped records, population adjustment weights, or secondary data with a provided weight variable. When applied correctly, SPSS Weight Cases can help produce more accurate frequencies, percentages, means, crosstabs, and population-level estimates.
However, weighting cases should never be done blindly. Using the wrong SPSS weight variable can distort your results, inflate your weighted N, affect chi-square output, change regression results, and lead to incorrect dissertation conclusions. The goal is not just to know where the Weight Cases button is. You must know when to use it, when not to use it, how to turn it off, and how to explain the results in academic writing.
Need help checking whether your SPSS dataset should be weighted? Our PhD-level SPSS dissertation data analysis experts can review your dataset, identify the correct weight variable, run weighted analysis, interpret the output, and help you write your results chapter. Request Quote Now.
What Does It Mean to Weight Cases in SPSS?
To weight cases in SPSS means telling SPSS that some cases should count more than others during analysis. In a normal unweighted dataset, each row usually counts as one respondent, one patient, one student, one customer, or one observation. When weighting is active, SPSS uses the value in the weight variable to decide how much influence each case should have.
For example, one row may represent one respondent, while another row may represent three respondents. If the weight value is 3, SPSS treats that case as contributing three times more than a case with a weight of 1.
| Case | Gender | Satisfaction | Weight |
|---|---|---|---|
| 1 | Female | High | 1 |
| 2 | Male | Low | 3 |
| 3 | Female | Medium | 2 |
In this example, Case 2 contributes more to the weighted analysis because its weight is 3. SPSS does not create extra visible rows in Data View, but it uses the weight value when calculating frequencies, percentages, means, and other statistics.
This is why weighted and unweighted outputs can look different. Your raw dataset may contain 300 rows, but after weighting, SPSS may show a weighted N of 1,250.7. That does not mean you collected 1,250.7 participants. It means the weighted total represents an adjusted count based on the weight variable.
| Term | Meaning |
|---|---|
| Raw sample size | The actual number of rows or participants in the dataset |
| Weighted count | The adjusted count after applying the weight variable |
| Weighted percentage | The percentage calculated from weighted counts |
| Weight variable | The numeric variable SPSS uses to decide how much each case should count |
| Weighted N | The total count SPSS reports after weights are applied |
The key idea is simple: weighting does not change the dataset rows you see, but it changes how SPSS analyzes those rows.
Why Researchers Weight Cases in SPSS
Researchers weight cases in SPSS because raw data does not always represent the target population correctly. In some datasets, one row represents several identical cases. A survey sample may also overrepresent one group while underrepresenting another. National datasets sometimes include official weights that researchers must apply before analysis.
In dissertation research, case weighting is common in nursing, public health, psychology, education, business, healthcare research, market research, and social science studies.
For example, a public health student may use a national health survey where young adults are overrepresented and older adults are underrepresented. A nursing student may analyze patient satisfaction data where one row represents multiple patients with the same response. A business student may weight customer survey responses according to regional market size. A psychology student may use a national mental health dataset with a final sampling weight.
Researchers commonly use SPSS Weight Cases for these reasons:
- To analyze frequency-count data.
- To apply official survey weights.
- To adjust for unequal representation in a sample.
- To make estimates better reflect a target population.
- To analyze grouped data correctly.
- To follow dataset documentation for secondary data analysis.
- To produce weighted frequencies and weighted percentages.
- To compare raw sample results with population-adjusted estimates.
Weighting is especially useful when the purpose of the analysis is to estimate population-level patterns rather than only describe the sample collected.
Before You Apply Weight Cases in SPSS: Quick Checklist
Before clicking Data → Weight Cases, check your dataset carefully. This checklist can prevent common SPSS weighting errors.
| Checklist Question | Why It Matters |
|---|---|
| Do I have a valid weight variable? | SPSS needs a numeric variable to apply weighting |
| Do I know what the weight variable represents? | Frequency weights, sampling weights, and complex survey weights are not the same |
| Is the weight variable numeric? | String variables cannot be used properly as weight variables |
| Are there missing values in the weight variable? | Missing weights can remove or misrepresent cases |
| Are there zero or negative values? | These may cause cases to contribute nothing or create invalid weighting |
| Are there extreme values? | Extreme weights can dominate results |
| Does the dataset documentation recommend weighting? | Official guidance helps justify the method |
| Do I need SPSS Complex Samples instead? | Complex survey designs may require more than ordinary Weight Cases |
| Have I saved a copy of the unweighted dataset? | You may need to compare weighted and unweighted output |
| Do I know how to turn weights off? | Leaving weights on is one of the most common SPSS mistakes |
SPSS warning: Do not apply Weight Cases just because a variable has the word “weight” in its name. Always confirm what the variable means and whether it fits your analysis.
When Should You Weight Cases in SPSS?
You should weight cases in SPSS only when there is a clear research, statistical, or documentation-based reason. Weighting should be linked to the dataset structure, the research design, or the instructions provided with the data.
Your Dataset Contains Frequency Counts
One of the clearest reasons to use Weight Cases is when your dataset contains frequency counts. In this type of dataset, each row does not represent one participant. Instead, each row represents a group of cases with the same response.
For example:
| Response | Count |
|---|---|
| Agree | 45 |
| Neutral | 20 |
| Disagree | 15 |
If SPSS analyzes this dataset without weighting, it may treat it as only three rows. That would be wrong because the count variable shows that the responses represent 80 people in total. In this situation, the count variable can be used as a frequency weight.
Your Survey Dataset Includes an Official Weight Variable
Large survey datasets often include official weight variables. These variables may be named:
- final_weight
- sample_weight
- person_weight
- household_weight
- population_weight
- survey_weight
- analysis_weight
- respondent_weight
A dataset provider may instruct users to apply a specific weight before producing estimates. This is common in government surveys, public health datasets, education datasets, household surveys, and large social science datasets.
Before applying the weight, read the dataset documentation. Do not assume that every weight variable should be used for every analysis. Some datasets include separate weights for individuals, households, adults, children, special modules, or follow-up samples.
Your Sample Needs to Reflect a Target Population
Sometimes your raw sample does not match the population you want to describe. For example, your target population may be 60% female and 40% male, but your sample may be 80% female and 20% male. If a correct weight variable has been created, weighting may help your results better reflect the target population.
This is common in survey-based dissertations where the researcher wants to estimate population percentages or compare results with known population characteristics.
Your Supervisor or Methodology Requires Weighting
Some supervisors, research methods chapters, or dataset instructions may require weighted analysis. For example, a student using a public health survey may be instructed to apply the final sampling weight before reporting prevalence estimates. A student using education survey data may be told to use student-level weights instead of school-level weights.
When weighting is required, you should explain the reason clearly in your methodology chapter.
You Are Producing Population-Level Descriptive Estimates
Weighting is often appropriate when your goal is to estimate population-level frequencies, percentages, proportions, or totals. For example, you may want to estimate the percentage of adults with poor mental health, the proportion of patients satisfied with care, or the estimated number of students affected by a learning barrier.
In these cases, unweighted results may describe only the sample, while weighted results may better represent the target population.
When Should You Not Weight Cases in SPSS?
Weighting cases in SPSS is useful, but it can also be dangerous when used incorrectly. You should not weight cases simply because the option exists or because your results look better after weighting.
Avoid weighting cases when:
- No valid weight variable exists.
- You do not know what the weight variable represents.
- The weight variable has missing values that have not been checked.
- The weight variable contains zero, negative, or extreme values.
- You are trying to make insignificant results significant.
- The dataset documentation does not support weighting.
- You are unsure whether the variable is a frequency weight, sampling weight, or complex survey weight.
- The analysis requires SPSS Complex Samples instead of ordinary Weight Cases.
- Your supervisor has asked for raw sample results only.
- You are describing the actual collected sample rather than population-adjusted estimates.
Dissertation caution: Weighting cannot repair poor sampling, biased data collection, weak measurement, or missing data problems. It can improve representation only when the weight variable has been designed correctly and used for the right purpose.
Frequency Weights vs Sampling Weights vs Complex Survey Weights
Students often confuse frequency weights, sampling weights, and complex survey weights. This is one of the biggest reasons SPSS weighting mistakes happen.
| Type of Weight | Meaning | Example | SPSS Tool Often Used | Main Caution |
|---|---|---|---|---|
| Frequency weight | One row represents multiple identical cases | Count = 25 | Data → Weight Cases | Best for grouped or count data |
| Sampling weight | Adjusts for unequal selection or representation | One respondent represents a larger population group | Weight Cases or survey-specific method | Must follow dataset documentation |
| Complex survey weight | Works with survey design features such as strata and clusters | National survey with PSU, strata, and final weight | SPSS Complex Samples | Standard Weight Cases may be insufficient |
A frequency weight is simple. If one row represents 25 people, the weight tells SPSS to treat that row as 25 cases.
A sampling weight is common in survey research. It may adjust for unequal probability of selection, nonresponse, or population representation. For example, one respondent may represent many people in the target population.
A complex survey weight is part of a broader sampling design. Complex surveys may include strata, clusters, primary sampling units, multistage sampling, and design effects. In this case, ordinary SPSS Weight Cases may not fully account for the sampling design.
Expert note: If your dataset includes variables such as strata, cluster, PSU, design weight, replicate weight, or sampling unit, check whether SPSS Complex Samples is required before using only ordinary Weight Cases.
Preparing Your Weight Variable Before Analysis
Before you weight cases in SPSS, inspect the weight variable carefully. This step is important because a bad weight variable can produce misleading output.
A proper SPSS weight variable should be:
- Numeric
- Non-missing
- Non-negative
- Correctly coded
- Clearly documented
- Reasonable in range
- Appropriate for the analysis
- Not confused with an ID variable
- Not confused with a group variable
- Not used without methodological justification
Examples of common weight variable names include:
- weight
- freq_weight
- final_weight
- sample_weight
- person_weight
- household_weight
- population_weight
- survey_weight
- analysis_weight
To inspect your weight variable in SPSS:
- Go to Analyze.
- Click Descriptive Statistics.
- Choose Frequencies or Descriptives.
- Move the weight variable into the analysis box.
- Check the minimum, maximum, mean, missing values, and unusual values.
- Review whether the weight values are mostly reasonable or whether some values are extremely high.
You should also check Variable View to confirm that the weight variable is numeric. If the weight variable is stored as a string, it may not appear correctly in the Weight Cases dialog box.
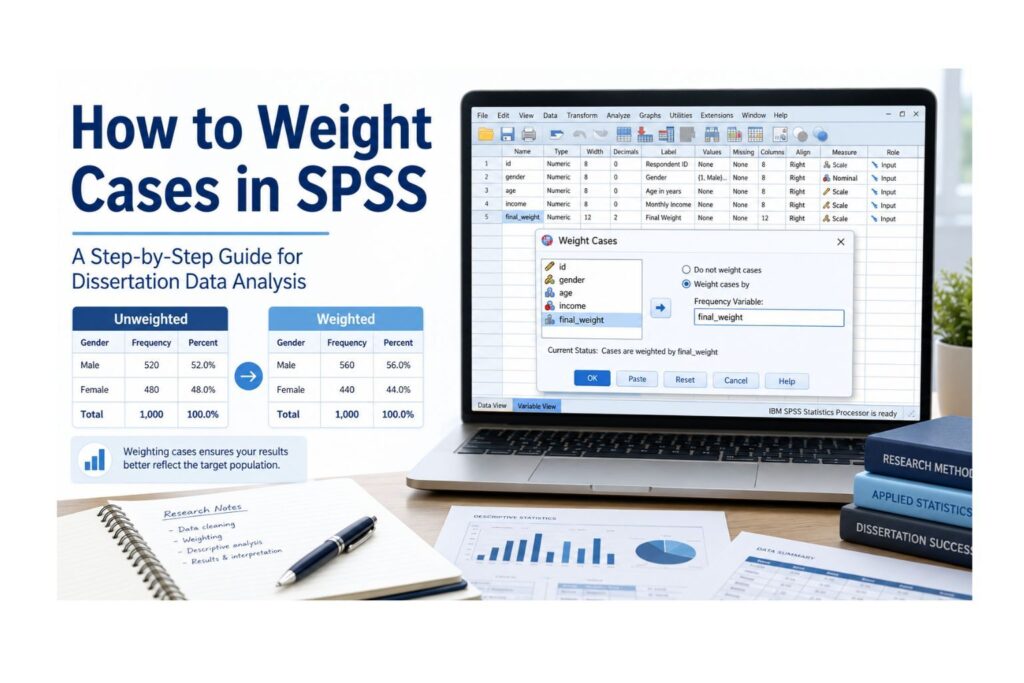
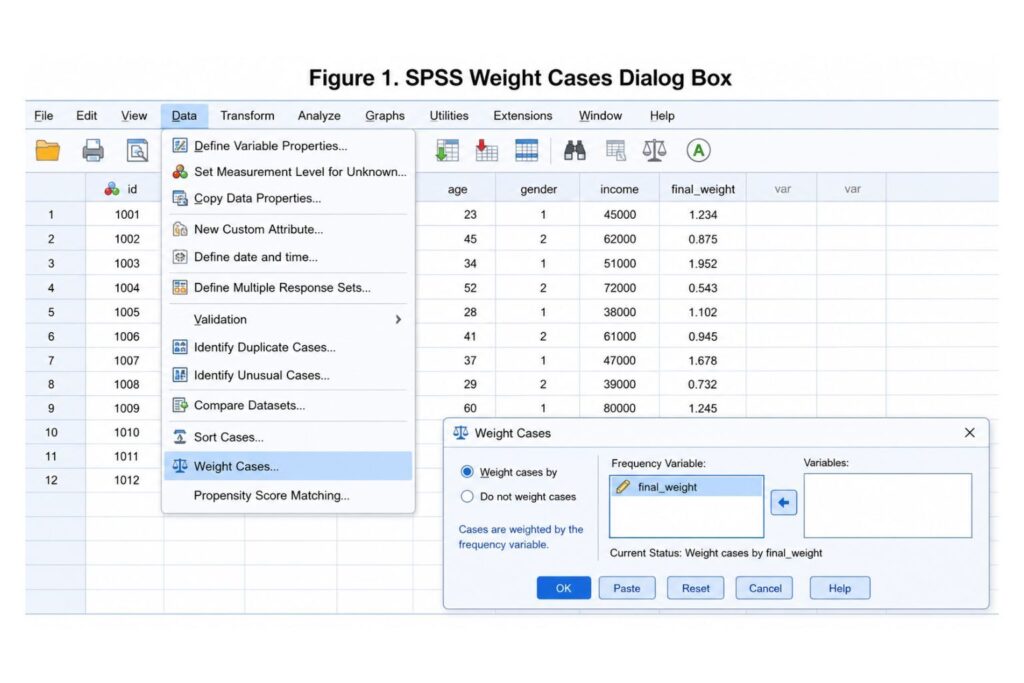
Step-by-Step: How to Weight Cases in SPSS Using the Menu
The easiest way to weight cases in SPSS is through the Data menu.
Follow these steps:
- Open your dataset in SPSS.
- Go to Data.
- Click Weight Cases.
- Select Weight cases by.
- Move your numeric weight variable into the Frequency Variable box.
- Click OK.
- Confirm that weighting is active before running your analysis.
After clicking OK, SPSS applies the selected weight variable to later analyses. Your frequencies, percentages, descriptive statistics, crosstabs, and some other outputs may now be weighted.
SPSS does not create visible duplicate rows in your dataset. It uses the weight variable during calculations.
Important: SPSS keeps the weight active until you turn it off. If you forget to turn it off, later analyses may be weighted by mistake.
How to Turn Off Weight Cases in SPSS
Turning weights off is just as important as turning them on. Many students forget that SPSS continues using the weight variable until it is disabled.
To turn off Weight Cases in SPSS:
- Go to Data.
- Click Weight Cases.
- Select Do not weight cases.
- Click OK.
You should turn weights off when:
- You want to check the raw sample size.
- You are running unrelated analyses.
- You are exporting unweighted data.
- You are comparing weighted and unweighted results.
- You are running an analysis where weighting is not appropriate.
- You are preparing a raw descriptive table for your methodology chapter.
The syntax for turning weights off is:
WEIGHT OFF.SPSS warning: If your SPSS weight cases are not working as expected, first check whether the correct weight variable is active or whether a previous weight is still turned on.
How to Weight Cases in SPSS Using Syntax
SPSS syntax is useful for dissertation research because it improves transparency and reproducibility. Instead of relying only on menu clicks, syntax shows exactly which weight variable was applied and when it was turned off.
The basic syntax is:
WEIGHT BY weight_variable.For example:
WEIGHT BY final_weight.To turn weighting off:
WEIGHT OFF.A good dissertation workflow may look like this:
FREQUENCIES VARIABLES=gender satisfaction.

WEIGHT BY final_weight.

FREQUENCIES VARIABLES=gender satisfaction.

WEIGHT OFF.
This syntax first runs unweighted frequencies, then applies the weight, runs weighted frequencies, and finally turns weighting off.
This is useful because you can compare unweighted and weighted output before deciding what to report.
Expert note: Keep your SPSS syntax file with your dissertation analysis records. It helps you defend your analysis process if your supervisor, examiner, or statistician asks how the results were produced.
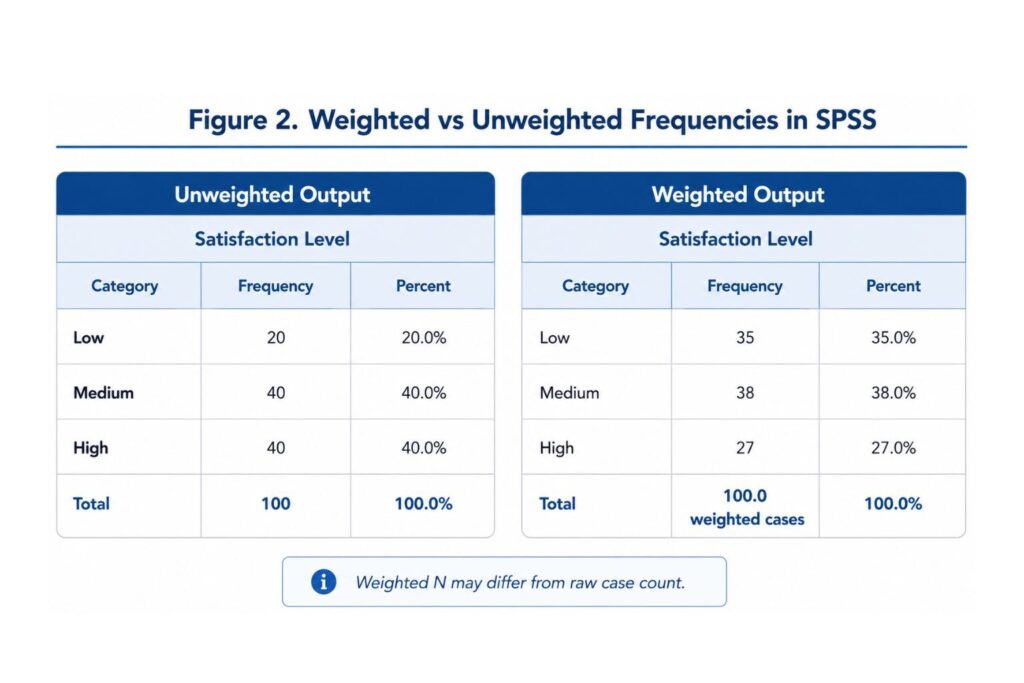
Example 1: Weighted Frequencies in SPSS
Suppose a student is analyzing satisfaction levels in a healthcare survey. The raw sample may show one distribution, but after applying the weight variable, the weighted frequency table may change.
| Satisfaction Level | Unweighted Frequency | Weighted Frequency | Interpretation |
|---|---|---|---|
| Low | 20 | 35 | Low satisfaction is more represented after weighting |
| Medium | 40 | 38 | Medium satisfaction changes slightly |
| High | 40 | 27 | High satisfaction is less represented after weighting |
In the unweighted results, high satisfaction appears to be just as common as medium satisfaction. After weighting, low satisfaction becomes more prominent. This may happen when respondents with low satisfaction represent a larger share of the target population.
Weighted frequencies can be useful, but they must be interpreted carefully. The unweighted frequency tells you how many cases appear in the raw dataset. The weighted frequency tells you the adjusted count after applying the weight variable.
Example 2: Weighted Crosstabs in SPSS
Weighting can also affect cross-tabulation results. A crosstab compares two categorical variables, such as gender and satisfaction level, treatment group and outcome, or education level and employment status.
For example, suppose a student runs a crosstab of gender by satisfaction level. In the unweighted data, male and female respondents may appear evenly distributed. After applying weights, one gender group may contribute more to the weighted percentages because it represents a larger share of the target population.
This matters because students often use crosstabs before running chi-square tests. If weights are active, the crosstab counts, percentages, and sometimes test results may differ from the unweighted analysis.
SPSS warning: If you are using survey data with a complex sampling design, standard weighted crosstabs may not fully account for design effects. Check whether SPSS Complex Samples is required.
Example 3: Weighted Descriptive Statistics in SPSS
Weights can also affect descriptive statistics such as means, standard deviations, totals, and percentages.
Suppose a nursing student calculates the mean patient satisfaction score. In the unweighted data, every patient contributes equally. In the weighted data, some groups may contribute more because they represent a larger population segment.
| Statistic | Unweighted Result | Weighted Result |
|---|---|---|
| Mean satisfaction score | 3.80 | 3.45 |
| Valid N | 150 | 520.6 |
| Standard deviation | 0.92 | 1.05 |
The weighted mean is lower than the unweighted mean. This suggests that the groups with lower satisfaction had greater influence after weighting.
The weighted N may also be much larger than the actual number of rows. It may contain decimals if the weight variable contains decimal values. This is normal in many survey datasets, but it must be explained properly in your dissertation.
Why Is My Weighted N Different in SPSS?
One of the most common student questions is: “Why is my weighted N different in SPSS?”
Your weighted N is different because SPSS is using the weight variable to adjust the contribution of each case. If some cases have weights greater than 1, the weighted total may become larger than the actual sample size. If some weights are less than 1, the weighted total may become smaller.
For example:
| Actual Dataset | Weighted Output |
|---|---|
| Actual number of rows | 300 |
| Weighted N after applying final_weight | 1,250.7 |
This does not mean the student collected 1,250.7 responses. It means the analysis is estimating an adjusted count based on the weight variable.
In dissertation writing, you should be careful not to report weighted N as if it were the actual sample size. A better approach is to state the actual sample size and explain that weighted estimates were used where appropriate.
Example:
“The dataset included 300 valid respondents. Weighted estimates were calculated using the final weight variable to adjust for population representation.”
How to Know Whether Weighting Is Active in SPSS
One of the most common SPSS mistakes is forgetting that Weight Cases is still active. This can lead to incorrect results in later analyses.
You can confirm that weighting is active by:
- Checking the SPSS status bar.
- Reviewing the output notes.
- Looking at your syntax history.
- Running Frequencies before and after weighting.
- Comparing raw N with weighted N.
- Returning to Data → Weight Cases and checking the selected option.
If weighted results look unusual, check whether a weight is still active before assuming there is a problem with the dataset.
Dissertation caution: Always document when you turned weights on and off. This protects your analysis from accidental errors.
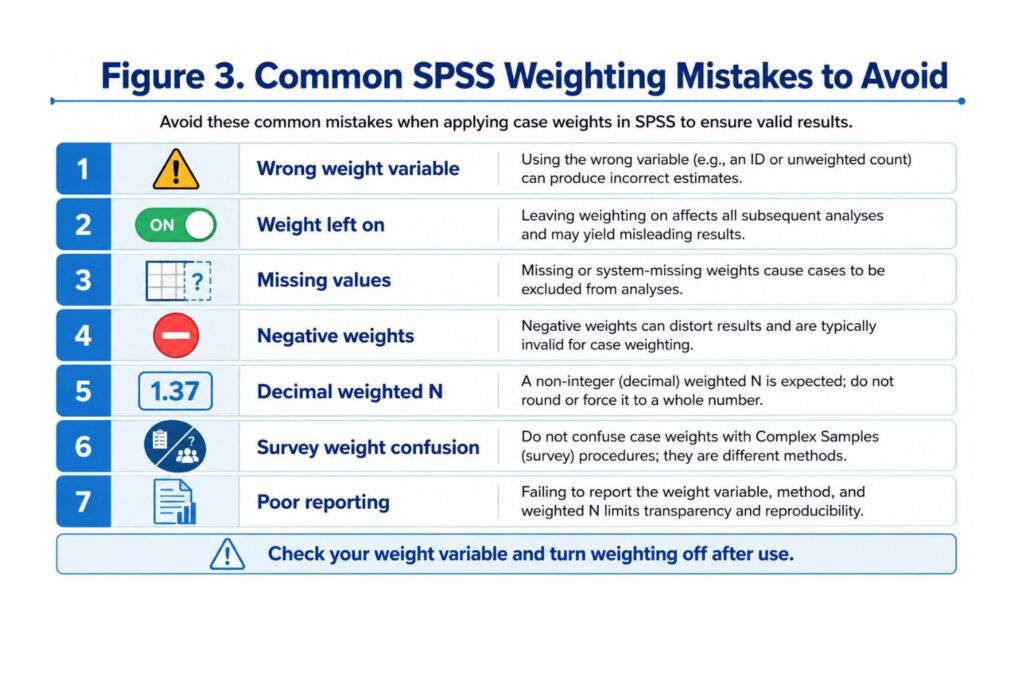
Common Mistakes When Weighting Cases in SPSS
Weighting mistakes can affect frequencies, percentages, means, crosstabs, chi-square tests, regression models, and dissertation conclusions.
| Mistake | Why It Is a Problem | How to Fix It |
|---|---|---|
| Using the wrong weight variable | Results may become misleading | Check dataset documentation |
| Forgetting to turn weights off | Later analyses may be weighted by mistake | Use WEIGHT OFF after weighted analysis |
| Using a string variable as a weight | SPSS requires a numeric weight variable | Convert or recode the variable correctly |
| Ignoring missing weights | Cases may be excluded or misrepresented | Check missing values first |
| Using negative weights | Negative weights are not meaningful for standard weighting | Clean or verify the variable |
| Confusing survey weights with frequency weights | The wrong procedure may be used | Check whether Complex Samples is needed |
| Reporting weighted results without saying so | Readers may misunderstand the sample size | State weighting in methodology and results |
| Assuming weighting fixes a poor sample | Weighting cannot repair every sampling problem | Explain limitations |
| Using weights to force significance | This is poor statistical practice | Use weighting only when justified |
| Ignoring weighted vs unweighted N | Sample size may be misreported | Report actual N and weighted estimates clearly |
| Failing to compare weighted and unweighted output | You may miss major changes caused by weighting | Review both outputs before reporting |
| Applying weights to every analysis automatically | Some analyses may not require weighting | Match weighting to the research purpose |
Does Weighting Cases Change Sample Size in SPSS?
Weighting does not change the actual number of rows in your dataset, but it can change the sample size shown in SPSS output.
This happens because SPSS reports weighted counts after applying the weight variable. For example, your dataset may have 300 actual respondents, but after weighting, the output may show a weighted N of 1,250.7.
| Type of N | Meaning |
|---|---|
| Actual N | The real number of cases or rows in the dataset |
| Weighted N | The adjusted count after applying the weight variable |
| Valid N | The number of cases included in a specific analysis |
| Missing N | Cases excluded because of missing values |
A weighted N with decimals is not automatically an error. Decimal weighted counts can occur when the weight variable contains decimal values. This is common in survey datasets.
The main issue is reporting. You should not confuse the actual sample size with the weighted estimate.
Should You Report Weighted or Unweighted Results?
Whether you report weighted or unweighted results depends on your research design, dataset documentation, supervisor instructions, and analysis goal.
You may report unweighted results when you are describing the actual sample collected. You may report weighted results when your goal is to estimate population-level patterns or follow official dataset instructions.
In many dissertations, it is useful to review both outputs before deciding what to present. The unweighted output shows the raw sample. The weighted output shows adjusted estimates.
You may need to report both when:
- Your supervisor requests it.
- Weighting substantially changes the results.
- You want to show transparency.
- You are describing both the sample and target population.
- Your dataset documentation recommends comparing weighted and unweighted results.
- Your results chapter needs to distinguish actual N from weighted percentages.
A strong dissertation approach is to explain the weighting decision in the methodology chapter before presenting the results.
SPSS Weight Cases vs Select Cases vs Split File vs Sort Cases vs Complex Samples
SPSS has several data management features that students sometimes confuse. Weight Cases is different from Select Cases, Split File, Sort Cases, and Complex Samples.
| SPSS Feature | What It Does | When to Use It | Main Risk |
|---|---|---|---|
| Weight Cases | Changes how much influence each case has | Frequency data, survey weights, population adjustment | Wrong weight can distort results |
| Select Cases | Includes or excludes cases | Analyzing a subgroup | Accidentally filtering out cases |
| Split File | Runs separate analyses by group | Producing output separately by gender, class, or treatment group | Forgetting Split File is active |
| Sort Cases | Rearranges row order | Organizing data by ID, date, group, or score | Does not change analysis by itself |
| Complex Samples | Handles survey design features | Stratified, clustered, weighted survey data | Requires correct design variables |
If you need to work with related SPSS data management tools, read our guides on how to select cases in SPSS, how to split file in SPSS, how to sort cases in SPSS, and how to filter data in SPSS.
You can also get expert support through our SPSS data analysis help and dissertation data analysis help services.
How to Report Weighted SPSS Results in a Dissertation
If you use weighted analysis, you must report it clearly. Do not present weighted output without explaining the weight variable, why it was used, and what it means for interpretation.
In your methodology chapter, include:
- The name of the weight variable.
- The reason for weighting.
- The source of the weight variable.
- Whether weighted or unweighted results are reported.
- Whether the weight was supplied by the dataset provider.
- Whether Complex Samples was considered or used.
- Any limitations related to weighting.
- Whether actual N and weighted N are reported separately.
Methodology Reporting Template 1
“Cases were weighted in SPSS using the variable [weight variable name]. The weighting procedure was applied to adjust for [reason for weighting]. Weighted frequencies and percentages are reported unless otherwise stated.”
Methodology Reporting Template 2
“The dataset provider supplied a final sampling weight, [weight variable name], which was applied before descriptive analysis. This allowed the estimates to better reflect the target population.”
Results Reporting Template 1
“Weighted frequencies indicated that [percentage]% of respondents reported [category], compared with [percentage]% in the unweighted sample.”
Results Reporting Template 2
“Both weighted and unweighted frequencies were reviewed. The weighted results are presented because the study aimed to estimate population-level patterns.”
Weighted N Reporting Template
“The actual sample included [N] respondents. After applying the weight variable, the weighted N was [weighted N]. Weighted percentages are reported for population-adjusted interpretation.”
Limitation Reporting Template
“Although weighting improved population representation, the results should be interpreted in light of the original sampling design and the assumptions underlying the weight variable.”
These templates can be adapted for nursing, public health, psychology, education, business, and social science dissertations.
Troubleshooting: SPSS Weight Cases Problems and Fixes
The Weight Variable Does Not Appear in the Dialog Box
If the weight variable does not appear in the Weight Cases dialog box, it may be stored as a string variable. SPSS requires a numeric variable for weighting. Check Variable View and confirm the variable type.
My Results Did Not Change After Weighting
If results do not change, the weight values may all be 1, the wrong variable may have been selected, or weighting may not have been applied correctly. It is also possible that the selected weight has little effect on that specific analysis.
My Weighted N Is Too Large
A large weighted N may occur when the weight represents population counts or frequency counts. This does not mean your actual sample size increased. It means SPSS is using the weight variable to estimate a larger represented count.
My Weighted N Has Decimals
Decimal weighted N values are common when sampling weights contain decimal values. This often happens in survey datasets. Explain this clearly in your results section if it affects interpretation.
Some Cases Disappeared After Weighting
Cases with missing, zero, or invalid weights may contribute nothing or be excluded from some weighted outputs. Inspect the weight variable before applying it.
SPSS Weight Cases Is Still On
If your later results look strange, check whether Weight Cases is still active. Go to Data → Weight Cases and select Do not weight cases, or run:
WEIGHT OFF.Then rerun any affected analyses.
I Am Not Sure Whether to Use Complex Samples
If your dataset has strata, clusters, PSU, or design variables, ordinary Weight Cases may not be enough. You may need SPSS Complex Samples to account for the full survey design.
Pricing, Trust, and Expert SPSS Support
Weighting cases can look simple, but one wrong decision can affect your entire dissertation results chapter. Students often contact us after their weighted frequency table does not match their raw sample size, their weighted N has decimals, their supervisor asks for justification, or their SPSS output changes unexpectedly after applying Weight Cases.
SPSSDissertationHelp.com provides affordable, confidential, and expert-led SPSS support for dissertation students. Our PhD-level data analysis experts can help you check your weight variable, decide whether weighting is appropriate, compare weighted and unweighted output, run the correct analysis, and write a clear interpretation.
We can support you with:
- SPSS Weight Cases setup
- Weighted frequency tables
- Weighted descriptive statistics
- Weighted crosstabs
- Chi-square interpretation
- Regression support
- Survey-weighted analysis guidance
- Methodology writing
- Results chapter interpretation
- Dissertation-ready tables
Need help before submitting your SPSS results? Request Quote Now and get expert guidance before weighting mistakes affect your dissertation.
Why Students Need Expert Help With SPSS Weight Cases
Weighting cases in SPSS can affect nearly every part of your analysis. It can change frequencies, percentages, means, crosstabs, chi-square tests, regression output, survey estimates, and dissertation conclusions.
Many students struggle because they are not sure which weight variable to use, whether they should report weighted or unweighted results, or whether SPSS Complex Samples is required. Others apply a weight correctly but do not know how to explain the weighted N, decimal counts, or differences between raw and adjusted percentages.
SPSSDissertationHelp.com can help you:
- Check whether weighting is appropriate.
- Identify the correct weight variable.
- Inspect and clean the weight variable.
- Apply Weight Cases correctly.
- Compare weighted and unweighted output.
- Run weighted frequencies, crosstabs, descriptives, and regression.
- Decide whether SPSS Complex Samples is needed.
- Interpret SPSS output.
- Write your methodology and results sections.
- Prepare dissertation-ready tables.
Our PhD-level SPSS data analysis experts provide affordable dissertation support, clear explanations, confidential assistance, and well-written results interpretation. Request Quote Now and get help before weighted results distort your dissertation findings.
FAQ: How to Weight Cases in SPSS
What does Weight Cases mean in SPSS?
Weight Cases in SPSS means applying a numeric weight variable so that some cases count more than others during analysis. It is commonly used for frequency-count data, survey weights, and population adjustment.
How do I weight cases in SPSS?
Go to Data → Weight Cases, select Weight cases by, move the numeric weight variable into the Frequency Variable box, and click OK. You can also use syntax such as WEIGHT BY final_weight.
How do I turn off Weight Cases in SPSS?
Go to Data → Weight Cases, select Do not weight cases, and click OK. You can also use the syntax command WEIGHT OFF.
Why is my weighted N different in SPSS?
Your weighted N is different because SPSS uses the weight variable to adjust how much each case contributes to the analysis. The weighted N may be larger, smaller, or decimal depending on the values in the weight variable.
Why does my weighted N have decimals?
Weighted N may have decimals when the weight variable contains decimal values. This is common in survey datasets where weights are used to estimate population-level results.
Should I use weighted or unweighted results in my dissertation?
It depends on your research design, dataset documentation, supervisor instructions, and analysis purpose. You may report unweighted results for the raw sample and weighted results for population-adjusted estimates.
Can I use Weight Cases for survey data?
Yes, but only when appropriate. Some survey datasets require ordinary Weight Cases, while others require SPSS Complex Samples because they include strata, clusters, and design variables.
What is the difference between Weight Cases and Complex Samples in SPSS?
Weight Cases applies a weight variable to standard SPSS procedures. Complex Samples is used for survey designs involving weights, strata, clusters, and sampling units. Complex Samples is often more appropriate for national or multistage survey datasets.
Can weighting cases affect chi-square results?
Yes. Weighting can change crosstab counts, percentages, and chi-square results. If you run weighted chi-square tests, explain the weighting procedure clearly.
Can weighting cases affect regression results?
Yes. Weighted data can affect regression coefficients, standard errors, and model interpretation. For complex survey data, ordinary weighted regression may not fully account for survey design effects.
What happens if I forget to turn weights off in SPSS?
SPSS may apply the weight variable to later analyses by mistake. This can produce incorrect results. Always use WEIGHT OFF after completing weighted analysis.
Can SPSS Weight Cases fix a poor sample?
No. Weighting can improve representation when properly designed, but it cannot fully repair poor sampling, biased data collection, missing data, or weak research design.
Conclusion
Learning how to weight cases in SPSS is essential when working with frequency data, survey datasets, population estimates, and dissertation research that requires adjusted analysis. Weighting can make your results more representative when the weight variable is valid and the research design supports it.
However, weighting must be applied carefully. You must know whether you are using a frequency weight, sampling weight, or complex survey weight. You must inspect the weight variable, compare weighted and unweighted results, understand why weighted N may differ from actual N, turn weights off after analysis, and explain the procedure clearly in your dissertation.
Need help applying weights in SPSS? Our SPSS dissertation data analysis experts can check your weight variable, apply the correct procedure, interpret weighted results, and help you write your methodology and results chapters. Request Quote Now.