Many students open SPSS, see several demographic variables in their dataset, and then get stuck. They may have age, gender, race, education level, marital status, employment status, income group, year of study, treatment group, or years of experience, but they do not know how to turn those variables into one clean demographic table for Chapter 4.
The challenge is not only knowing how to create a demographic table in SPSS. The real challenge is knowing which SPSS procedure to use, which statistics to report, how to combine separate SPSS outputs into one table, and how to format the final table in APA style. Some students incorrectly report means for categorical variables. Others copy several raw SPSS frequency tables directly into Word, making their results chapter look messy and unprofessional.
This guide explains how to create, format, interpret, and report a demographic table in SPSS for a dissertation, thesis, capstone, research paper, nursing project, psychology assignment, public health study, or social science report. You will learn when to use Frequencies, Descriptives, Explore, Crosstabs, and Custom Tables, and how to turn SPSS output into a clean table that fits Chapter 4.
For students who need help with SPSS tables, APA formatting, interpretation, or Chapter 4 writing, our SPSS dissertation help team can support you from dataset review to final results presentation.
How Do You Create a Demographic Table in SPSS?
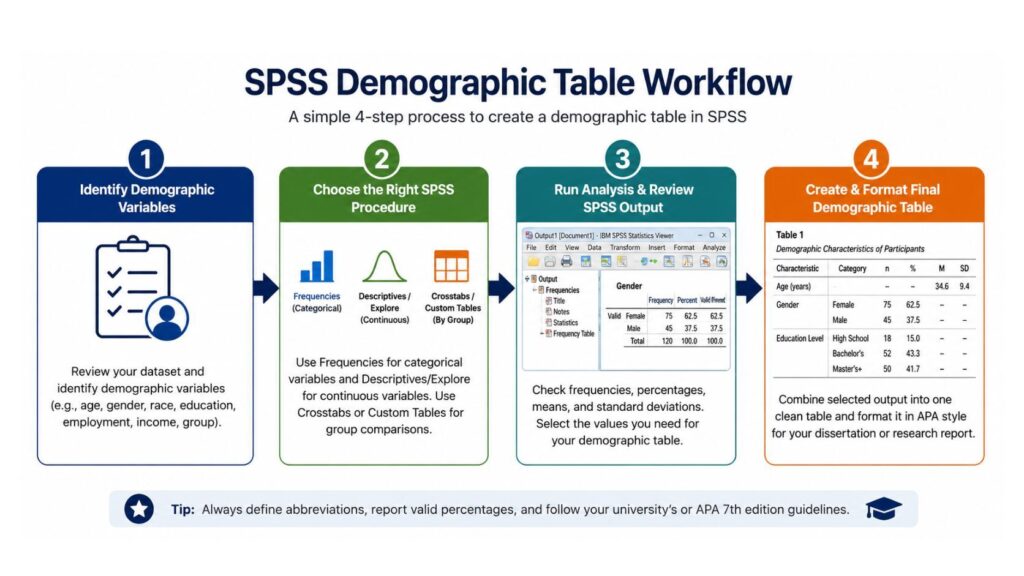
To create a demographic table in SPSS, first identify the demographic variables in your dataset. Then separate categorical variables from continuous variables. Use Frequencies for categorical variables such as gender, race, education level, marital status, and employment status. Use Descriptives or Explore for continuous variables such as age, years of experience, or income measured as a numeric value. After running the output, combine the relevant frequencies, percentages, means, and standard deviations into one clean demographic table.
Students searching for how to make demographic table in SPSS, how to create demographic table in SPSS, or how to make a demographic table in SPSS usually need the same process: classify variables correctly, run the right SPSS procedure, review the output, and format the table for dissertation or APA-style reporting.
For most Chapter 4 results sections, do not paste every raw SPSS output table into your document. Create one clear table that summarizes the sample.
What Is a Demographic Table?
A demographic table is a summary table that describes the characteristics of the participants, respondents, patients, students, employees, or cases included in a study. It usually appears near the beginning of the results section because readers need to understand who participated before they interpret the main findings.
In dissertations and research papers, demographic tables are sometimes called participant characteristics tables, sample description tables, baseline characteristics tables, or respondent profile tables. The table may describe the whole sample or compare characteristics across groups, such as intervention versus control, male versus female, undergraduate versus graduate, or treatment group A versus treatment group B.
A demographic table may include categorical variables such as gender, race, ethnicity, education level, employment status, marital status, diagnosis group, or treatment group. It may also include continuous variables such as age, years of professional experience, income, baseline score, or length of employment.
A strong demographic table helps readers quickly answer questions such as:
- Who participated in the study?
- How large was each category?
- What was the average age or experience level?
- Were the groups similar at baseline?
- Does the sample match the population being studied?
A demographic table is not the place for deep interpretation or causal claims. It describes the sample so the reader can understand the context of the later statistical results.
What Variables Should You Include in a Demographic Table?
The variables included in a demographic table should come from your research topic, methodology, population, and data collection instrument. Do not include every variable simply because it exists in the dataset. A good demographic table is selective, relevant, and easy to read.
Common demographic variables include age, gender, sex, race, ethnicity, education level, marital status, employment status, income category, year of study, location, professional experience, clinical diagnosis, treatment group, and intervention/control status.
For example, a nursing dissertation might include age, gender, years of clinical experience, education level, job role, and department. A psychology study might include age, gender, race/ethnicity, education, marital status, and clinical group. A business study might include age, gender, education level, job position, years of experience, department, and income category.
The table should include variables that help readers understand the sample and evaluate whether the findings are meaningful for the target population. If a variable does not help describe the sample or support the research context, it may not belong in the demographic table.
Table 1: Common Demographic Variables and How to Summarize Them
| Demographic Variable | Type of Variable | Best SPSS Procedure | Recommended Statistic | Example Reporting Format |
|---|---|---|---|---|
| Age | Continuous | Descriptives or Explore | Mean and SD, or median and IQR | M = 34.6, SD = 9.4 |
| Gender | Categorical | Frequencies | n and % | Female, 75 (62.5%) |
| Race/ethnicity | Categorical | Frequencies | n and % | Black, 40 (33.3%) |
| Education level | Categorical/ordinal | Frequencies | n and % | Bachelor’s degree, 52 (43.3%) |
| Marital status | Categorical | Frequencies | n and % | Married, 60 (50.0%) |
| Employment status | Categorical | Frequencies | n and % | Full-time, 80 (66.7%) |
| Income group | Categorical/ordinal | Frequencies | n and % | $40,000–$59,999, 30 (25.0%) |
| Treatment group | Categorical | Frequencies or Crosstabs | n and % | Intervention, 60 (50.0%) |
| Years of experience | Continuous | Descriptives or Explore | Mean and SD, or median and IQR | M = 8.7, SD = 4.2 |
| Clinical diagnosis/group | Categorical | Frequencies or Crosstabs | n and % | Type 2 diabetes, 35 (29.2%) |
Categorical vs Continuous Demographic Variables
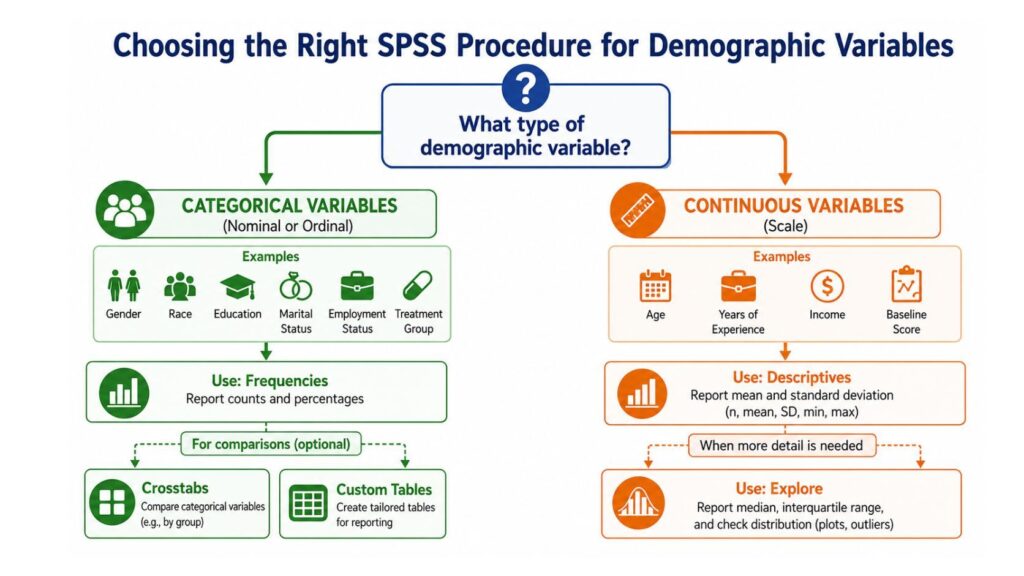
Before creating a demographic table in SPSS, you must know whether each demographic variable is categorical or continuous. This decision affects the SPSS procedure you use and the statistics you report.
Categorical variables place participants into groups. Examples include gender, race, ethnicity, education level, marital status, employment status, treatment group, and clinical diagnosis. These variables are usually summarized using frequencies and percentages. For example, a demographic table may report that 75 participants were female, representing 62.5% of the sample.
Continuous variables are measured numerically and can usually take many values. Examples include age, years of experience, income measured as an exact amount, number of working hours per week, or a baseline score. These variables are usually summarized using the mean and standard deviation when the distribution is approximately normal.
When continuous data are skewed, the median and interquartile range may be more appropriate. For example, income and years of experience may be skewed if a small number of participants have very high values.
This distinction matters because using the wrong statistic can make the table misleading. You should not report the mean of gender codes such as 1 = male and 2 = female. Those numbers are labels, not meaningful numeric values. Similarly, you should not report only frequencies for age if the study needs a concise summary of average age.
Method 1: Creating a Demographic Table Using SPSS Frequencies
The Frequencies procedure is the most common method for summarizing categorical demographic variables in SPSS. Use it for variables such as gender, race, ethnicity, education level, marital status, employment status, treatment group, and income category.
To create frequency output in SPSS:
- Open your dataset in SPSS.
- Go to Analyze.
- Click Descriptive Statistics.
- Select Frequencies.
- Move your categorical demographic variables into the Variables box.
- Click Statistics if you need additional statistics.
- Click Charts if you want bar charts or pie charts.
- Click OK.
- Review the frequency tables in the Output Viewer.
- Transfer the relevant values into one clean demographic table.
The SPSS frequency table usually includes Frequency, Percent, Valid Percent, and Cumulative Percent.
- Frequency shows the number of participants in each category.
- Percent calculates percentages using all cases, including missing cases.
- Valid Percent calculates percentages using only cases with valid responses.
- Cumulative Percent adds percentages across ordered categories.
For demographic tables, students often use Valid Percent when some participants have missing demographic responses. However, you must be consistent and transparent. If you use Valid Percent, make sure the table note explains that percentages are based on valid responses.
Kent State University’s guide on SPSS frequencies for categorical variables is useful for understanding how SPSS summarizes categorical variables using the Frequencies procedure.
For a more detailed tutorial, see our internal guide on frequency analysis in SPSS.
Method 2: Creating a Demographic Table Using SPSS Descriptives or Explore
The Descriptives procedure is used for continuous demographic variables such as age, years of experience, income as a numeric value, baseline score, or number of hours worked per week.
To run Descriptives in SPSS:
- Go to Analyze.
- Click Descriptive Statistics.
- Select Descriptives.
- Move continuous variables such as age or years of experience into the Variables box.
- Click Options.
- Select mean, standard deviation, minimum, and maximum.
- Click Continue.
- Click OK.
- Review the output.
- Add the relevant values to your demographic table.
Descriptives is simple and useful when you only need the mean, standard deviation, minimum, and maximum.
Use Explore when you need more information about the distribution. Explore can provide medians, quartiles, confidence intervals, normality tests, and plots. This is useful when variables such as income or years of experience are skewed.
If the variable is approximately normally distributed, report the mean and standard deviation. If it is strongly skewed, consider reporting the median and interquartile range. Your university’s dissertation template, supervisor, or journal guidelines may also influence the reporting format.
Method 3: Creating a Demographic Table Using SPSS Custom Tables
SPSS Custom Tables can create cleaner combined tables, especially when you need demographic characteristics by group. For example, you may want to compare gender, age, education level, and employment status across intervention and control groups.
Custom Tables is useful because it allows you to place variables in rows and groups in columns. You can request counts, percentages, means, and standard deviations in a more publication-friendly format. However, not every SPSS license includes the Custom Tables module, so some students may need to use Frequencies and Descriptives separately.
To create a demographic table using Custom Tables:
- Go to Analyze.
- Select Tables.
- Click Custom Tables.
- Drag demographic variables into the rows.
- Drag study group, treatment group, or comparison group into the columns if needed.
- Choose counts, column percentages, means, or standard deviations.
- Adjust category ordering where needed.
- Click OK.
- Review and format the output.
IBM’s official SPSS Custom Tables documentation provides detailed technical guidance on creating custom tables, comparing groups, and summarizing variables in SPSS.
Custom Tables is powerful, but raw output may still need APA formatting before it is added to Chapter 4.
Table 2: SPSS Procedure to Use Based on the Demographic Table You Need
| Goal | Best SPSS Tool | Output Produced | When to Use It | Limitation |
|---|---|---|---|---|
| Describe one categorical variable | Frequencies | Counts and percentages | Gender, race, education | Produces separate output tables |
| Describe multiple categorical variables | Frequencies | Several frequency tables | General demographic profile | Requires manual combining |
| Describe continuous variables | Descriptives | Mean, SD, minimum, maximum | Age, years of experience | Limited distribution details |
| Compare demographics by group | Crosstabs or Custom Tables | Group counts and percentages | Intervention vs control groups | May require careful formatting |
| Create publication-style combined table | Custom Tables | Cleaner combined table | Grouped demographic tables | May require SPSS module access |
| Check missing demographic data | Frequencies | Missing and valid counts | Before final reporting | Must interpret missingness carefully |
| Prepare output for APA formatting | Frequencies, Descriptives, Custom Tables | Raw output for editing | Dissertation and manuscript tables | Raw output is not final APA format |
How to Create a Demographic Table by Group in SPSS
Many dissertations require demographic tables by group. For example, a study may compare intervention and control groups, male and female participants, undergraduate and graduate students, or treatment A and treatment B.
For categorical demographic variables by group, use Crosstabs or Custom Tables. Crosstabs can show counts and percentages for categories across groups. For example, it can show how many males and females are in the intervention and control groups.
To use Crosstabs:
- Go to Analyze.
- Click Descriptive Statistics.
- Select Crosstabs.
- Place the demographic variable in the Row box.
- Place the group variable in the Column box.
- Click Cells.
- Select Count and the appropriate percentage, often Column Percent.
- Click Continue.
- Click OK.
For continuous demographic variables by group, use Compare Means, Explore, or Custom Tables. For example, you may report the mean age and standard deviation for each study group.
Only include p-values in a demographic table if your methodology, supervisor, or journal requires baseline comparison testing. Some researchers discourage unnecessary p-values for baseline demographic differences, especially in randomized studies, because the table’s main goal is to describe the sample, not test every characteristic.
How to Combine SPSS Output Into One Clean Demographic Table
SPSS often produces separate output tables for each variable. However, your dissertation should usually present one clean demographic table, not several raw SPSS tables.
A typical demographic table may look like this:
Table 1
Demographic Characteristics of Participants
| Characteristic | Category | n | % | M | SD |
|---|---|---|---|---|---|
| Age | — | — | — | 34.6 | 9.4 |
| Gender | Female | 75 | 62.5 | — | — |
| Gender | Male | 45 | 37.5 | — | — |
| Education | Bachelor’s degree | 52 | 43.3 | — | — |
This structure allows categorical and continuous variables to appear in the same table. Categorical variables use n and %, while continuous variables use M and SD.
If your study compares groups, the table may need extra columns for Total Sample, Group 1, Group 2, and possibly p-value. However, do not add p-values unless they are methodologically justified.
Raw SPSS output is useful for analysis, but the final table should be edited and formatted for readers. You can also export the final output to Word after cleaning it. See our guide on how to export SPSS output to Word if you need help moving output into your dissertation document.
Sample Demographic Table Format for Dissertation or APA Style
A dissertation demographic table should be simple, readable, and consistent. APA-style tables should use clear headings, minimal lines, and table notes when abbreviations need explanation. The official APA guidance on tables and figures provides useful rules for presenting tables clearly in academic writing.
Below is a sample APA-friendly demographic table.
Table 3: Sample APA-Style Demographic Table
| Characteristic | Category | n | % | M | SD |
|---|---|---|---|---|---|
| Age | — | — | — | 34.6 | 9.4 |
| Gender | Female | 75 | 62.5 | — | — |
| Gender | Male | 45 | 37.5 | — | — |
| Race/ethnicity | White | 42 | 35.0 | — | — |
| Race/ethnicity | Black | 38 | 31.7 | — | — |
| Race/ethnicity | Hispanic/Latino | 25 | 20.8 | — | — |
| Race/ethnicity | Asian | 10 | 8.3 | — | — |
| Race/ethnicity | Other/prefer not to say | 5 | 4.2 | — | — |
| Education level | High school diploma | 18 | 15.0 | — | — |
| Education level | Bachelor’s degree | 52 | 43.3 | — | — |
| Education level | Master’s degree or higher | 50 | 41.7 | — | — |
| Employment status | Full-time | 80 | 66.7 | — | — |
| Employment status | Part-time | 25 | 20.8 | — | — |
| Employment status | Not employed | 15 | 12.5 | — | — |
| Years of experience | — | — | — | 8.7 | 4.2 |
Note. Percentages are based on valid responses. M = mean; SD = standard deviation.
This table is much cleaner than several separate SPSS frequency outputs. It gives the reader a quick summary of the sample without overwhelming them.
For more help with APA reporting, see our guide on how to report SPSS results in APA format.
How to Interpret a Demographic Table in SPSS
A demographic table does more than display numbers. It describes the sample. The interpretation should be concise and focused on the most important characteristics.
For example:
“Table 1 presents the demographic characteristics of the participants. The sample included 120 respondents. Most participants identified as female, had a bachelor’s degree or higher, and were employed full time. The mean age was 34.6 years.”
This interpretation describes the sample without repeating every number in the table. You do not need to write a sentence for every category unless it is important to the study.
Avoid overinterpreting demographic tables. Do not claim that gender caused an outcome simply because the demographic table shows more female than male participants. Demographic tables describe the sample; they do not test causal relationships.
A good demographic interpretation supports sample description, group comparability, external validity, reader understanding, and Chapter 4 organization.
For broader output guidance, see our page on how to interpret SPSS output.
How to Report a Demographic Table in Chapter 4
A demographic table usually appears near the beginning of Chapter 4, before the main inferential results. This placement helps the reader understand the sample before reviewing the research questions or hypotheses.
Introduce the table before presenting it. Then summarize the most important details after the table. Do not repeat every number in the table. Focus on the characteristics that define the sample or matter to the study.
Example Chapter 4 wording:
“Table 1 presents the demographic characteristics of the participants. The sample consisted of 120 respondents, with most participants identifying as female (62.5%). The mean age was 34.6 years (SD = 9.4). Most participants reported having a bachelor’s degree or higher.”
If there are missing demographic values, mention them briefly or include a table note. If the study has groups, explain whether the table describes the total sample or separate groups.
For complete results support, see our Chapter 4 data analysis help page.
How to Format a Demographic Table in APA 7th Edition
APA 7th edition formatting helps make demographic tables clear and professional. The goal is not to reproduce raw SPSS output exactly. The goal is to present the necessary information in a readable academic format.
Use these APA-style table practices:
- write the table number in bold;
- write the table title in italic title case;
- use clear column headings;
- avoid excessive gridlines;
- keep decimal places consistent;
- report percentages with one decimal place where appropriate;
- define abbreviations in a table note;
- align numeric values clearly;
- avoid screenshots of raw SPSS tables;
- use Word table formatting when preparing the final document.
A raw SPSS table may contain extra columns such as Percent, Valid Percent, and Cumulative Percent. Your final APA table may only need n and %. Similarly, a Descriptives output may include minimum and maximum values, but the final demographic table may only need M and SD unless minimum and maximum are required.
Common Mistakes When Creating a Demographic Table in SPSS
One common mistake is using means for categorical variables. For example, if gender is coded as 1 = male and 2 = female, the mean of that variable is not meaningful for a demographic table. Use frequencies and percentages instead.
Another mistake is reporting frequency without percentage. Frequencies are useful, but percentages help readers understand the size of each category relative to the sample.
Students also confuse Percent and Valid Percent. Percent includes missing cases in the denominator, while Valid Percent excludes missing cases. If missing values exist, Valid Percent is often more useful, but the table note should be clear.
Another common error is copying every SPSS output table into Word. This makes Chapter 4 look unedited. Instead, combine the relevant values into one clean demographic table.
Some students include too many variables. A demographic table should describe the sample, not list every survey item. Others include p-values without any methodological reason. P-values should only be added when group comparisons are required.
Table 4: Common Demographic Table Mistakes and Fixes
| Mistake | Why It Is a Problem | Correct Approach |
|---|---|---|
| Using means for categorical variables | Category codes are labels, not true numbers | Use frequencies and percentages |
| Reporting frequency without percentage | Readers cannot easily judge proportions | Report both n and % |
| Using Percent without checking missing data | Percent may include missing cases | Use Valid Percent when appropriate and explain it |
| Copying every SPSS output table into Word | Makes Chapter 4 messy and repetitive | Combine output into one clean table |
| Ignoring missing values | Percentages may be misleading | Review valid and missing cases |
| Mixing total and group results without labels | Readers may not know what the numbers represent | Use clear column headings |
| Failing to format in APA style | Raw SPSS output may look unprofessional | Edit titles, notes, borders, and decimals |
| Reporting unnecessary variables | The table becomes cluttered | Include only relevant sample characteristics |
| Using screenshots of tables | Values cannot be edited and may look blurry | Use editable Word tables |
| Interpreting demographics as causal findings | Demographics describe the sample only | Keep interpretation descriptive |
| Including p-values without justification | Can distract from the table’s purpose | Add p-values only when required |
Trust Section: Why Students Trust SPSSDissertationHelp.com
Students trust SPSSDissertationHelp.com because we focus on practical academic data analysis support. Our assistance is designed for students working on dissertations, theses, capstones, assignments, and Chapter 4 results sections.
We help with SPSS output, demographic tables, frequency tables, descriptive statistics, APA table formatting, interpretation, and results reporting. Whether you are an undergraduate, master’s, DBA, EdD, DNP, PhD, nursing, public health, psychology, education, or social science student, we can help you present your findings clearly and professionally.
Our support is confidential and based on your dataset, instructions, university requirements, and deadline. We do not make unrealistic grade promises. Instead, we help you understand the correct SPSS procedure, prepare accurate tables, and write clear academic results.
For wider analysis support, visit our SPSS data analysis help page.
Pricing Section: How Much Does SPSS Demographic Table Help Cost?
The cost of SPSS demographic table help depends on the scope of work. A simple demographic table usually costs less than a full Chapter 4 analysis because it involves fewer statistical tests. However, the final price depends on the number of variables, the quality of the dataset, the required formatting, and the deadline.
Pricing may be affected by:
- number of demographic variables;
- whether the dataset is already clean;
- whether group comparisons are needed;
- whether APA formatting is required;
- whether interpretation is needed;
- whether the table must be exported to Word;
- urgency of the deadline;
- dissertation level;
- whether the work is only one demographic table or part of full Chapter 4.
Simple demographic table support usually costs less than a full Chapter 4 analysis because it involves fewer tests. However, urgent deadlines, messy datasets, many variables, group comparisons, or full APA reporting may increase the cost.
Request a quote now for accurate pricing based on your dataset, deadline, and required output.
Need Help Creating a Demographic Table in SPSS?
You may need expert help if you do not know which SPSS procedure to use, need a demographic table by group, need APA formatting, have messy SPSS output, or are unsure how to write the Chapter 4 narrative.
Students often ask for help when they have already run SPSS but do not know which numbers to report. Others need help combining Frequencies and Descriptives output into one clean table. Some need the table exported to Word and formatted according to university guidelines.
Our team can help you:
- identify the right demographic variables;
- run Frequencies, Descriptives, Explore, Crosstabs, or Custom Tables;
- prepare a demographic table by group;
- format the table in APA style;
- interpret the demographic results;
- export the output to Word;
- write the Chapter 4 demographic narrative;
- review the table before submission.
For full support, visit our dissertation data analysis help page.
Request a Quote Now
FAQs About Creating a Demographic Table in SPSS
To create a demographic table in SPSS, identify your demographic variables, separate categorical variables from continuous variables, run Frequencies for categorical variables, run Descriptives or Explore for continuous variables, and combine the relevant values into one clean table.
Use Analyze > Descriptive Statistics > Frequencies for categorical variables such as gender, race, education level, employment status, and marital status. Report the frequency and percentage for each category.
Use Analyze > Descriptive Statistics > Descriptives for continuous variables such as age and years of experience. Report the mean and standard deviation if the data are approximately normal. Use Explore if you need medians, quartiles, or distribution checks.
Frequencies is mainly used for categorical variables and produces counts and percentages. Descriptives is used for continuous variables and produces statistics such as mean, standard deviation, minimum, and maximum.
Use Valid Percent when there are missing values and you want percentages based only on valid responses. Use Percent when you want percentages based on all cases, including missing cases. Be consistent and explain your choice if needed.
Yes, SPSS Custom Tables can create combined demographic tables, especially when comparing groups. However, not all SPSS licenses include Custom Tables. Many students create separate Frequencies and Descriptives output, then combine the results manually into one clean table.
Use Crosstabs for categorical variables by group and Compare Means, Explore, or Custom Tables for continuous variables by group. For example, you can compare demographic characteristics between intervention and control groups.
Demographic tables should include p-values only when required by your methodology, supervisor, or journal. Many demographic tables are descriptive and do not need p-values.
Use a bold table number, italic title, clear column headings, consistent decimal places, minimal gridlines, and table notes for abbreviations. Do not paste raw SPSS output without editing.
You can paste SPSS output into Word, but raw SPSS output is usually not ready for a dissertation. It should be cleaned, combined, formatted, and explained before submission.
Include variables that describe the sample and support the study context. Common variables include age, gender, race/ethnicity, education level, marital status, employment status, income group, treatment group, and years of experience.
Yes. SPSSDissertationHelp.com can help you create demographic tables, format them in APA style, interpret the results, and write the Chapter 4 narrative based on your dataset and university requirements.
Conclusion
Learning how to create a demographic table in SPSS is important because demographic tables help describe your sample, organize Chapter 4, and present participant characteristics clearly. A strong demographic table helps readers understand who took part in your study before they examine the main statistical findings.
The correct process depends on your variables. Categorical variables usually need frequencies and percentages. Continuous variables usually need means and standard deviations, or medians and interquartile ranges when the data are skewed. If groups are being compared, you may need Crosstabs, Compare Means, Explore, or Custom Tables.
Do not paste raw SPSS output into your dissertation without reviewing it. Clean the output, combine the relevant values, format the table in APA style, and write a concise interpretation.
If you need help creating a demographic table in SPSS, formatting it in APA style, interpreting the results, or writing the Chapter 4 narrative, request SPSS dissertation help today. Our experts can review your dataset, prepare the correct table, and explain the results in clear academic language.