How to Do Ordinal Regression in SPSS
How to do ordinal regression in SPSS is a common question for students and researchers working with ordered outcome variables. Ordinal regression is used when the dependent variable has categories with a clear order, such as low, moderate, and high satisfaction, but the distance between the categories cannot be treated as equal.
This method is useful in dissertation research, especially when survey responses are measured using ordered categories. Examples include satisfaction level, agreement level, severity rating, confidence level, service quality rating, academic performance category, or purchase intention.
If you need support with ordinal regression, SPSS output interpretation, assumption checks, or dissertation results writing, visit SPSS Dissertation Help or submit your project through Request Quotes Now.
What Ordinal Regression Means in SPSS
Ordinal regression is a statistical method used to predict an ordered categorical dependent variable. The outcome variable has ranked categories, but the exact distance between those categories is not assumed to be equal.
| Ordinal Variable | Ordered Categories |
|---|---|
| Satisfaction level | Low, moderate, high |
| Agreement level | Strongly disagree, disagree, neutral, agree, strongly agree |
| Pain severity | None, mild, moderate, severe |
| Academic performance | Poor, fair, good, excellent |
| Purchase intention | Very unlikely, unlikely, neutral, likely, very likely |
| Service quality rating | Very poor, poor, average, good, excellent |
In SPSS, ordinal regression is usually run through the PLUM procedure. The most common model is the cumulative logit model, often called ordinal logistic regression.
When to Use Ordinal Regression in SPSS
Ordinal regression is suitable when your dependent variable is ordered and your research question focuses on prediction or association.
| Use Ordinal Regression When | Example |
|---|---|
| The dependent variable is ordinal | Satisfaction: low, moderate, high |
| The categories have a meaningful order | Strongly disagree to strongly agree |
| You have one or more predictors | Age, gender, income, education, service quality |
| You want to predict higher or lower outcome categories | Higher satisfaction or lower satisfaction |
| Linear regression is not suitable | Outcome is not continuous |
| Multinomial regression would ignore the order | Categories are ranked, not random |
For broader SPSS support, visit SPSS Data Analysis Help.
Examples of Dissertation Topics That Use Ordinal Regression
Ordinal regression is common in dissertation projects because many survey outcomes are ordered.
| Field | Example Research Question |
|---|---|
| Education | Do teaching method, study time, and prior performance predict student satisfaction level? |
| Nursing | Do age, treatment type, and health status predict pain severity? |
| Business | Do service quality, price perception, and trust predict customer loyalty level? |
| Psychology | Do stress, coping style, and social support predict anxiety severity? |
| Public health | Do income, access, and awareness predict healthcare service rating? |
| Management | Do leadership style and workload predict employee engagement level? |
For help with dissertation results presentation, visit Chapter 4 Dissertation Help.
Ordinal Regression vs Linear Regression vs Multinomial Regression
Choosing the correct regression method depends on the dependent variable.
| Method | Best Used When | Example Outcome |
|---|---|---|
| Linear regression | Dependent variable is continuous | Test score, income, scale mean |
| Binary logistic regression | Dependent variable has two categories | Yes/no, pass/fail |
| Multinomial logistic regression | Dependent variable has unordered categories | Preferred brand A, B, or C |
| Ordinal regression | Dependent variable has ordered categories | Low, medium, high |
Ordinal regression keeps the order of the dependent variable. Multinomial regression treats categories as separate unordered groups. Linear regression assumes a continuous outcome, which may not be suitable for ordinal response categories.
For more regression support, visit Regression Analysis Help.
Variables Needed for Ordinal Regression
Ordinal regression uses one ordinal dependent variable and one or more independent variables.
| Variable Type | Role | Example |
|---|---|---|
| Dependent variable | Ordered outcome | Satisfaction level |
| Continuous predictor | Numeric independent variable | Age, income, study hours |
| Categorical predictor | Grouping variable | Gender, program type |
| Ordinal predictor | Ordered independent variable | Education level |
| Factor in SPSS | Categorical predictor | Department, gender, group |
| Covariate in SPSS | Continuous predictor | Age, score, experience |
In SPSS, categorical predictors go into Factor(s), while continuous predictors go into Covariate(s).
Data Preparation Before Ordinal Regression
Before running ordinal regression, your dataset should be clean and correctly coded.
| Preparation Step | Why It Matters |
|---|---|
| Confirm the dependent variable is ordinal | The model must match the outcome |
| Check the category order | Results depend on the correct ranking |
| Add value labels | Output becomes easier to understand |
| Check missing values | Missing codes should not be treated as valid scores |
| Review predictor coding | Factors and covariates must be entered correctly |
| Inspect frequencies | Very small categories can weaken the model |
| Check reversed items | Scale direction must be consistent |
If your survey includes negatively worded items, you may need How to Reverse Code in SPSS before creating final variables.
Example Dataset for Ordinal Regression in SPSS
Assume a researcher wants to predict student satisfaction with dissertation supervision.
| Variable | Role | Coding |
|---|---|---|
| Satisfaction_Level | Dependent variable | 1 = Low, 2 = Moderate, 3 = High |
| Supervisor_Support | Covariate | Mean support score |
| Research_Confidence | Covariate | Mean confidence score |
| Program_Type | Factor | 1 = Coursework, 2 = Research |
| Study_Hours | Covariate | Weekly study hours |
The research question could be:
Do supervisor support, research confidence, program type, and study hours predict student satisfaction level?
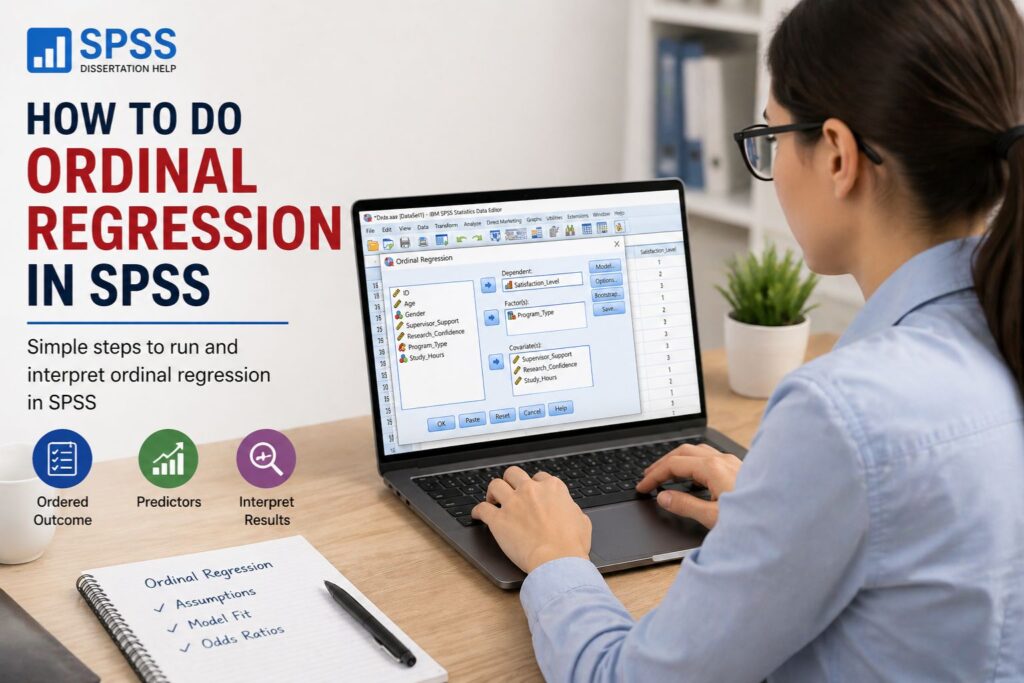
How to Do Ordinal Regression in SPSS
Use this SPSS menu path:
Analyze > Regression > Ordinal
| Step | SPSS Action | Purpose |
|---|---|---|
| 1 | Open the dataset | Load your variables |
| 2 | Click Analyze | Open the analysis menu |
| 3 | Select Regression | Open regression options |
| 4 | Choose Ordinal | Open ordinal regression |
| 5 | Move the ordered outcome to Dependent | Set the dependent variable |
| 6 | Move categorical predictors to Factor(s) | Add group variables |
| 7 | Move continuous predictors to Covariate(s) | Add numeric variables |
| 8 | Select output options | Request model fit and estimates |
| 9 | Run the analysis | Generate SPSS output |
| 10 | Interpret results | Explain model fit, assumptions, and predictors |
SPSS Dialog Box Setup
| SPSS Box | Variable Type | Example |
|---|---|---|
| Dependent | Ordinal outcome | Satisfaction_Level |
| Factor(s) | Categorical predictors | Program_Type |
| Covariate(s) | Continuous predictors | Supervisor_Support, Research_Confidence, Study_Hours |
This setup tells SPSS which variable is being predicted and which variables are used as predictors.
Important SPSS Output Options
Several output options help with proper interpretation.
| Output Option | Why It Helps |
|---|---|
| Model fitting information | Tests whether the model improves prediction |
| Goodness-of-fit | Checks whether the model fits the data reasonably |
| Parameter estimates | Shows predictor effects |
| Test of parallel lines | Checks proportional odds assumption |
| Confidence intervals | Shows precision of estimates |
| Descriptive statistics | Summarizes variables |
A dissertation write-up should explain the model, assumptions, predictors, and practical meaning of the findings.
SPSS Syntax for Ordinal Regression
SPSS syntax helps you save and reproduce the analysis.
PLUM Satisfaction_Level WITH Supervisor_Support Research_Confidence Study_Hours
  BY Program_Type
  /CRITERIA = CIN(95) DELTA(0) MXITER(100) MXSTEP(5) LCONVERGE(0) PCONVERGE(1.0E-6)
  /LINK = LOGIT
/PRINT = FIT PARAMETER SUMMARY TPARALLEL.| Syntax Element | Meaning |
|---|---|
| PLUM | Runs ordinal regression |
| Satisfaction_Level | Ordinal dependent variable |
| WITH | Adds continuous covariates |
| BY | Adds categorical factors |
| LINK = LOGIT | Uses the logit link function |
| PRINT = FIT | Requests model fit |
| PARAMETER | Requests parameter estimates |
| TPARALLEL | Requests test of parallel lines |
Choosing the Link Function
SPSS offers several link functions. The logit link is the most commonly used for ordinal logistic regression.
| Link Function | Common Use |
|---|---|
| Logit | General ordinal logistic regression |
| Probit | When assuming a normal underlying distribution |
| Complementary log-log | When higher categories are more frequent |
| Negative log-log | When lower categories are more frequent |
| Cauchit | When extreme responses are more common |
Most dissertation projects use the logit link unless the research design suggests another option.
Assumptions of Ordinal Regression
Ordinal regression has assumptions that should be checked before interpreting results.
| Assumption | Meaning |
|---|---|
| Ordinal dependent variable | Outcome categories must be ordered |
| Independent observations | Each case should be independent |
| No severe multicollinearity | Predictors should not be too highly related |
| Adequate category frequencies | Categories should have enough cases |
| Proportional odds assumption | Predictor effects should be consistent across thresholds |
The proportional odds assumption is one of the most important assumptions in ordinal logistic regression.
Understanding the Proportional Odds Assumption
The proportional odds assumption means that each predictor has a consistent effect across the thresholds of the dependent variable.
For example, if satisfaction has three categories, SPSS considers:
| Threshold | Comparison |
|---|---|
| Threshold 1 | Low vs moderate/high |
| Threshold 2 | Low/moderate vs high |
SPSS checks this using the Test of Parallel Lines.
| Test Result | Meaning |
|---|---|
| p > .05 | Assumption is usually acceptable |
| p < .05 | Assumption may be violated |
A non-significant result is usually preferred for the test of parallel lines.
How to Interpret Ordinal Regression Output in SPSS
SPSS ordinal regression output contains several tables. Each table has a specific purpose.
| SPSS Table | What It Shows |
|---|---|
| Case Processing Summary | Number of cases and category distribution |
| Model Fitting Information | Whether predictors improve the model |
| Goodness-of-Fit | Whether the model fits reasonably |
| Pseudo R-Square | Approximate explanatory strength |
| Parameter Estimates | Which predictors are significant |
| Test of Parallel Lines | Whether the proportional odds assumption is met |
Case Processing Summary
The case processing summary shows how many cases were included and how the dependent variable is distributed.
| Satisfaction Level | N | Percentage |
|---|---|---|
| Low | 40 | 20.0% |
| Moderate | 90 | 45.0% |
| High | 70 | 35.0% |
| Total | 200 | 100.0% |
This table helps confirm whether all outcome categories have enough cases.
Model Fitting Information
The model fitting table compares the intercept-only model with the final model.
| Model | -2 Log Likelihood | Chi-Square | df | Sig. |
|---|---|---|---|---|
| Intercept Only | 315.42 | |||
| Final | 276.18 | 39.24 | 4 | .001 |
A significant p-value means the final model predicts the ordinal outcome better than the intercept-only model.
Example Interpretation
The ordinal regression model significantly improved prediction of satisfaction level compared with the intercept-only model, χ²(4) = 39.24, p = .001. This indicates that the predictors collectively contributed to explaining differences in satisfaction level.
Goodness-of-Fit Table
The goodness-of-fit table includes Pearson and deviance tests.
| Test | Chi-Square | df | Sig. |
|---|---|---|---|
| Pearson | 184.32 | 190 | .603 |
| Deviance | 176.85 | 190 | .742 |
Non-significant values are generally preferred because they suggest that the model fits the data reasonably.
Example Interpretation
The Pearson and deviance goodness-of-fit tests were not significant, suggesting that the ordinal regression model fit the data adequately.
Pseudo R-Square
SPSS provides pseudo R-square values.
| Measure | Value |
|---|---|
| Cox and Snell | .178 |
| Nagelkerke | .206 |
| McFadden | .091 |
Pseudo R-square values do not work exactly like R-square in linear regression. They provide an approximate indication of model explanatory strength.
Example Interpretation
The Nagelkerke pseudo R-square value was .206, suggesting that the model had moderate explanatory strength. This value should be interpreted as an approximate measure rather than a direct equivalent of linear regression R-square.
Parameter Estimates
The parameter estimates table shows the effect of each predictor.
| Predictor | Estimate | Std. Error | Wald | df | Sig. | Exp(B) |
|---|---|---|---|---|---|---|
| Supervisor Support | 0.682 | 0.184 | 13.72 | 1 | .001 | 1.98 |
| Research Confidence | 0.415 | 0.162 | 6.56 | 1 | .010 | 1.51 |
| Study Hours | 0.058 | 0.027 | 4.61 | 1 | .032 | 1.06 |
| Program Type | -0.306 | 0.221 | 1.91 | 1 | .167 | 0.74 |
A positive estimate usually means the predictor increases the odds of being in a higher category of the outcome, assuming the dependent variable is coded from low to high.
Example Interpretation
Supervisor support significantly predicted satisfaction level, B = 0.682, p = .001. The odds ratio, Exp(B) = 1.98, suggests that higher supervisor support was associated with greater odds of being in a higher satisfaction category.
Interpreting Odds Ratios
Odds ratios help explain the practical meaning of ordinal regression results.
| Exp(B) Value | Meaning |
|---|---|
| Greater than 1 | Higher odds of being in a higher outcome category |
| Equal to 1 | No change in odds |
| Less than 1 | Lower odds of being in a higher outcome category |
| Predictor | Exp(B) | Interpretation |
|---|---|---|
| Supervisor Support | 1.98 | Higher support nearly doubles the odds of higher satisfaction |
| Research Confidence | 1.51 | Higher confidence increases the odds of higher satisfaction |
| Study Hours | 1.06 | Each additional hour slightly increases the odds |
| Program Type | 0.74 | Lower odds compared with the reference group |
Always interpret odds ratios based on how your dependent variable and predictors are coded.
Test of Parallel Lines
The test of parallel lines checks whether the proportional odds assumption is met.
| Model | -2 Log Likelihood | Chi-Square | df | Sig. |
|---|---|---|---|---|
| Null Hypothesis | 276.18 | |||
| General | 263.91 | 12.27 | 8 | .140 |
A non-significant result suggests that the assumption is acceptable.
Example Interpretation
The test of parallel lines was not significant, χ²(8) = 12.27, p = .140. This suggests that the proportional odds assumption was met.
What to Do If the Parallel Lines Assumption Is Violated
A significant test of parallel lines suggests that the proportional odds assumption may be violated. The next step depends on the data and research question.
| Possible Response | Explanation |
|---|---|
| Check category coding | Make sure the outcome order is correct |
| Review sparse categories | Very small categories may affect the model |
| Combine categories carefully | Only combine categories when conceptually justified |
| Consider another model | Multinomial logistic regression may be considered |
| Report the limitation | Explain the assumption issue clearly |
Assumption problems should be handled carefully, especially in dissertation research.
Reporting Ordinal Regression in APA Style
A strong report should include the model test, assumption check, significant predictors, odds ratios, and interpretation.
APA-Style Example
An ordinal logistic regression was conducted to examine whether supervisor support, research confidence, study hours, and program type predicted student satisfaction level. The final model significantly improved prediction compared with the intercept-only model, χ²(4) = 39.24, p = .001. The test of parallel lines was not significant, χ²(8) = 12.27, p = .140, indicating that the proportional odds assumption was met.
Supervisor support significantly predicted satisfaction level, B = 0.682, SE = 0.184, Wald = 13.72, p = .001, Exp(B) = 1.98. This suggests that higher supervisor support was associated with greater odds of being in a higher satisfaction category. Research confidence also significantly predicted satisfaction level, B = 0.415, p = .010, Exp(B) = 1.51. Study hours significantly predicted satisfaction level, B = 0.058, p = .032, Exp(B) = 1.06. Program type was not statistically significant, p = .167.
Ordinal Regression Results Table for Chapter 4
| Predictor | B | SE | Wald | p-value | Exp(B) | Interpretation |
|---|---|---|---|---|---|---|
| Supervisor Support | 0.682 | 0.184 | 13.72 | .001 | 1.98 | Significant positive predictor |
| Research Confidence | 0.415 | 0.162 | 6.56 | .010 | 1.51 | Significant positive predictor |
| Study Hours | 0.058 | 0.027 | 4.61 | .032 | 1.06 | Significant positive predictor |
| Program Type | -0.306 | 0.221 | 1.91 | .167 | 0.74 | Not significant |
This type of table helps readers understand both the statistical results and the practical meaning of the predictors.
Ordinal Regression and Likert Scale Data
Ordinal regression is often used when a single Likert-type item is the dependent variable. However, if several Likert items are combined into a mean score, another method may sometimes be more suitable.
| Data Type | Possible Method |
|---|---|
| Single Likert item outcome | Ordinal regression |
| Ordered satisfaction category | Ordinal regression |
| Mean of several Likert items | Linear regression may sometimes be suitable |
| Binary recoded outcome | Binary logistic regression |
| Unordered categories | Multinomial logistic regression |
The correct method depends on the research question, measurement level, distribution, and supervisor requirements.
Ordinal Regression for Survey Data Analysis
Survey-based dissertations often use ordinal outcomes. Ordinal regression can help examine how demographic, behavioral, and perception-based predictors relate to ordered responses.
| Survey Outcome | Possible Predictors |
|---|---|
| Satisfaction level | Service quality, trust, price perception |
| Agreement level | Awareness, education level, experience |
| Intention level | Attitude, perceived usefulness, risk perception |
| Severity level | Age, health status, treatment type |
| Engagement level | Motivation, workload, leadership support |
For survey-focused support, visit Survey Data Analysis Services.
Common Mistakes When Doing Ordinal Regression in SPSS
| Mistake | Why It Is a Problem |
|---|---|
| Treating ordinal outcomes as continuous without justification | May lead to unsuitable linear regression |
| Using multinomial regression when order matters | Ignores the ordered structure of the outcome |
| Forgetting to check category order | Results may be interpreted backward |
| Ignoring the test of parallel lines | Assumption problems may be missed |
| Misreading thresholds as predictors | Thresholds are not main predictors |
| Reporting only p-values | Interpretation becomes weak |
| Ignoring odds ratios | Practical meaning becomes unclear |
| Not checking missing values | Estimates may be affected |
How Ordinal Regression Supports Dissertation Chapter 4
Ordinal regression can strengthen Chapter 4 when the research question involves ordered outcomes. It allows the researcher to report model fit, predictor significance, odds ratios, and assumption checks.
| Chapter 4 Area | Contribution |
|---|---|
| Descriptive statistics | Shows distribution of the ordinal outcome |
| Assumption checks | Reports the test of parallel lines |
| Inferential analysis | Tests predictor effects |
| Model summary | Explains overall model significance |
| Interpretation | Connects findings to research questions |
| Tables | Presents clear statistical evidence |
A strong Chapter 4 should explain the results clearly rather than simply pasting SPSS output.
Professional Help With Ordinal Regression in SPSS
Ordinal regression can be challenging when the dependent variable has several ordered categories, predictors are mixed, or SPSS output includes tables that are difficult to interpret. The analysis also requires careful attention to category order, model fit, odds ratios, and the test of parallel lines.
SPSSDissertationhelp.com supports students and researchers with ordinal regression, assumption checks, SPSS output interpretation, APA-style reporting, and dissertation results writing.
| Support Area | What It Covers |
|---|---|
| Data preparation | Coding, missing values, and category checks |
| Model selection | Confirming whether ordinal regression fits the research question |
| SPSS analysis | Running the ordinal regression procedure correctly |
| Assumption checks | Reviewing the test of parallel lines |
| Output interpretation | Explaining model fit, parameter estimates, and odds ratios |
| Chapter 4 writing | Presenting results clearly in dissertation format |
| APA reporting | Preparing clean tables and interpretation |
You can submit your project through Request Quotes Now.
FAQ: How to Do Ordinal Regression in SPSS
Ordinal regression in SPSS is a statistical method used to predict an ordered dependent variable, such as low, moderate, and high satisfaction.
Use ordinal regression when your dependent variable has ordered categories and you want to examine how predictors affect the likelihood of being in higher or lower categories.
Ordinal regression is found under Analyze > Regression > Ordinal.
The dependent variable is the ordered outcome, such as agreement level, satisfaction level, pain severity, or purchase intention.
Linear regression is used for continuous outcomes. Ordinal regression is used for ordered categorical outcomes.
Ordinal regression is used when outcome categories are ordered. Multinomial regression is used when categories are not ordered.
The proportional odds assumption means that predictor effects are consistent across the thresholds of the ordinal dependent variable.
SPSS provides the Test of Parallel Lines. A non-significant result usually suggests that the assumption is met.
Exp(B) is the odds ratio. It shows how the odds of being in a higher outcome category change as the predictor increases.
Yes. Ordinal regression can be used for a single Likert-type ordinal outcome. If several Likert items are combined into a scale score, another method may sometimes be more suitable.
Report the model fitting information, goodness-of-fit, pseudo R-square, parameter estimates, odds ratios, and test of parallel lines.
Yes. SPSSDissertationhelp.com can help with data preparation, ordinal regression in SPSS, assumption checks, output interpretation, APA tables, and Chapter 4 writing. Submit your request through Request Quotes Now.
Final Thoughts
Ordinal regression in SPSS is a useful method when the dependent variable has ordered categories. It helps researchers understand how predictors influence the likelihood of moving into higher or lower outcome levels. For dissertation work, the value of ordinal regression depends on choosing the right model, checking assumptions, interpreting odds ratios correctly, and presenting the results clearly.
For help with ordinal regression, SPSS output, APA reporting, or dissertation results interpretation, visit SPSS Dissertation Help or request support through Request Quotes Now.