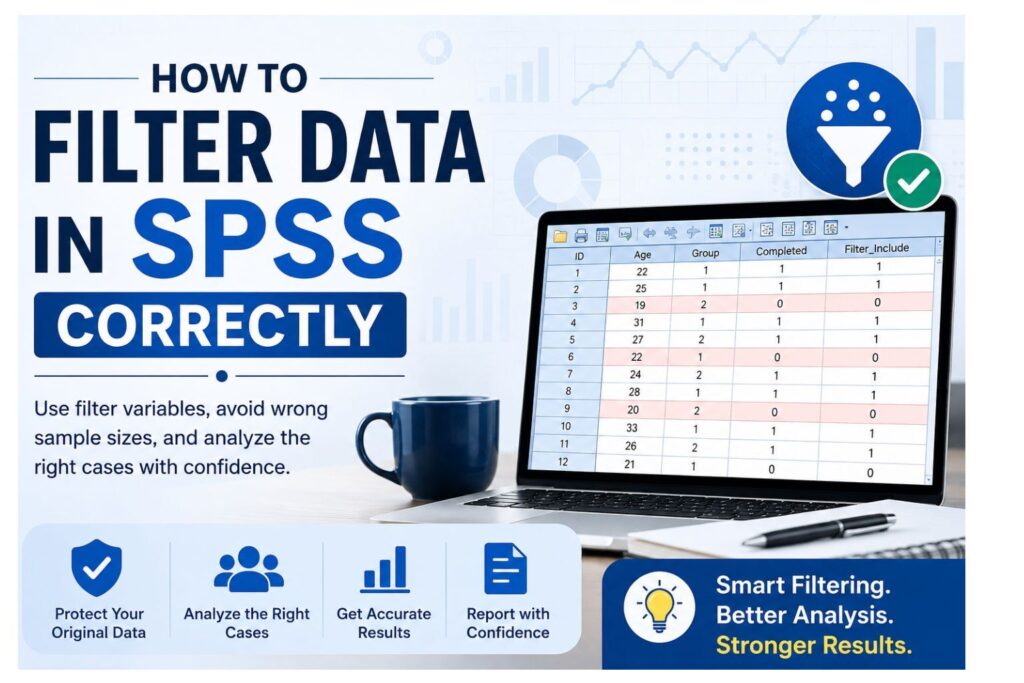
How to filter data in SPSS is an important skill when you want to analyze selected cases without deleting the rest of your dataset. SPSS filtering allows you to restrict analysis to eligible participants, completed survey responses, treatment groups, matched cases, valid scale responses, or any subgroup required by your research question.
For example, you may need to analyze only respondents aged 18 and above, only completed surveys, or only participants in a treatment group. Instead of deleting the other cases, you can apply a filter and run the analysis on the correct sample. As a result, you protect your original dataset while still focusing on the cases that matter for a specific test.
However, filtering must be done carefully. If a filter remains active, SPSS may use fewer cases than expected in frequencies, descriptive statistics, t-tests, ANOVA, chi-square tests, correlation, regression, or reliability analysis. Therefore, this guide explains how to filter data in SPSS safely, how to use a filter variable, how to turn filters off, and how to avoid common filtering mistakes.
Need help filtering, cleaning, or analyzing your SPSS data? Our SPSS dissertation help experts can help you prepare your dataset, run the correct analysis, and interpret your results.
What Does Filtering Data in SPSS Mean?
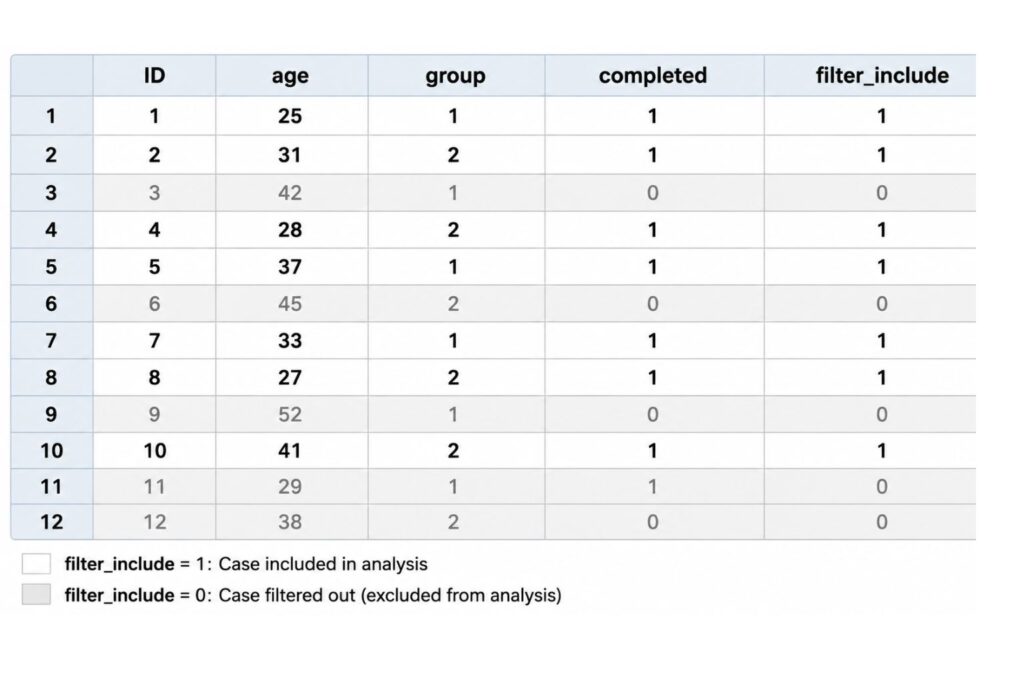
Filtering data in SPSS means temporarily excluding selected cases from analysis while keeping them in the dataset. The filtered-out rows remain in Data View, but SPSS does not include them in most statistical procedures while the filter is active.
This approach is useful when you want to analyze a subgroup without damaging your original data file. For instance, you may want to analyze only completed survey responses, only female respondents, only first-year students, or only participants who meet your inclusion criteria.
In SPSS, filtering is different from deleting. When you filter cases, SPSS keeps the cases in the dataset. When you delete cases, SPSS removes them from the working file. Because of this difference, filtering is usually safer for dissertation, thesis, capstone, and coursework analysis.
Key Terms to Understand Before Filtering
Before you filter data in SPSS, understand these terms:
- Included cases: cases that meet the filter rule and enter the analysis.
- Filtered-out cases: cases that remain in the dataset but do not enter analysis while the filter is active.
- Deleted cases: cases removed from the working dataset.
- Missing cases: cases with missing values on one or more variables.
- Weighted cases: cases whose contribution changes because a weight variable is active.
A good SPSS filtering rule should be clear, testable, and easy to report. You should know exactly why each case enters or leaves the analysis.
Filtering Data in SPSS vs Selecting Cases in SPSS
Filtering data in SPSS and selecting cases in SPSS are related, but they are not the same. Filtering is the active rule that tells SPSS which cases to include in analysis. Selecting Cases is the broader SPSS tool that can filter cases, delete unselected cases, copy selected cases to another dataset, select a random sample, or select cases by range.
This article focuses on how to filter data in SPSS. It does not replace a full tutorial on Select Cases. That distinction helps avoid confusion and prevents accidental deletion of valid cases.
Table 1: Filtering Data in SPSS vs Selecting Cases in SPSS
| Feature | Filtering Data in SPSS | Selecting Cases in SPSS | Best Use |
|---|---|---|---|
| Main purpose | Temporarily exclude cases from analysis | Choose cases using conditions, ranges, random samples, or deletion options | Use filtering for safe temporary analysis |
| Keeps unselected cases | Yes | Yes, if “Filter out unselected cases” is selected | Best when preserving the full dataset |
| Can delete cases | No, filtering itself does not delete cases | Yes, if “Delete unselected cases” is selected | Use deletion only with a backup |
| Uses filter variable | Usually yes | Can create or use a filter variable | Best for transparent analysis |
| Temporary analysis | Strong fit | Possible through filtering options | Good for subgroup analysis |
| Random sample option | Not the main focus | Available in Select Cases | Use for sampling workflows |
| Case range option | Not the main focus | Available in Select Cases | Use for testing or limiting rows |
| Risk level | Lower when used correctly | Higher if cases are deleted accidentally | Filtering is safer for students |
| Dissertation recommendation | Recommended for temporary exclusion | Use carefully and document the option selected | Keep a backup and save syntax |
For a full explanation of the Select Cases dialog, random sampling, case ranges, deleting unselected cases, and copying selected cases to a new dataset, read our complete guide on how to select cases in SPSS. You can also review our guides on how to clean data in SPSS, how to split file in SPSS, and how to merge files in SPSS if your dataset needs more preparation before analysis.
When Should You Filter Data in SPSS?
You should filter data in SPSS when your research question applies to only part of the dataset. Instead of deleting the remaining cases, you can keep the full file and analyze only the eligible subgroup.
Common reasons to filter data include:
- Analyzing only completed survey responses
- Including only participants who meet eligibility criteria
- Analyzing only respondents aged 18 years and above
- Running analysis for one study group
- Excluding cases with missing outcome values
- Analyzing only respondents who passed screening questions
- Running subgroup analysis by gender, department, education level, or treatment group
- Analyzing only matched pre-test and post-test participants
- Keeping the original dissertation dataset unchanged
For example, a student studying employee satisfaction may need to analyze only full-time employees. A healthcare researcher may need to analyze only patients who completed both baseline and follow-up assessments. In both cases, filtering allows the researcher to focus on the right cases without losing the rest of the dataset.
Before You Filter Data in SPSS
Before you filter data in SPSS, protect your original file. Many SPSS problems begin when students filter, delete, recode, or overwrite data without saving a backup. Therefore, your first step should always be to save a clean copy of the dataset.
Save a Backup Copy First
Save the original SPSS file before applying any filter. Use a clear file name such as:
- study_data_original.sav
- survey_data_before_filtering.sav
- dissertation_data_backup.sav
This protects you if you apply the wrong filter, delete cases accidentally, or overwrite your dataset.
Check Variable Coding
Next, check the variables you plan to use in the filter rule. SPSS filtering depends on stored values, not the labels you see on screen.
For example, your dataset may show value labels such as:
- Male
- Female
- Completed
- Not completed
- Treatment
- Control
However, SPSS may store those categories as numeric values such as 1, 2, 0, or 99. Before filtering, confirm what each value means.
Review Missing Values
Missing values can affect your filter rule. If your filter condition uses a variable with missing data, SPSS may exclude more cases than expected. Therefore, run frequencies before filtering.
You can check missing values using:
FREQUENCIES VARIABLES = age gender completed group.This helps you confirm how many valid and missing values exist before you filter cases.
Define the Inclusion Rule
Before applying a filter, write the inclusion rule in plain language. For example:
“Include only respondents aged 18 and above who completed the survey.”
Then translate that rule into SPSS syntax:
age >= 18 AND completed = 1This step helps you avoid unclear or incorrect filtering.
How to Filter Data in SPSS Using the Menu
The menu method is useful if you are new to SPSS. It allows you to apply a filter without writing syntax manually. However, you still need to understand what each option does.
Use this path:
Data > Select Cases > If condition is satisfied > If…
Then enter your condition in the “If” box.
For example, if you want to include only respondents aged 18 and above, enter:
age >= 18After writing the condition, choose:
Filter out unselected cases
This option tells SPSS to keep all cases in the dataset but exclude cases that do not meet the condition from analysis.
Do not choose:
Delete unselected cases
That option removes cases from the working dataset. If you save the file after deleting unselected cases, you may lose data unless you already saved a backup.
After you click OK, SPSS applies the filter. In Data View, filtered-out cases may appear with a slash or line through the case number, depending on your SPSS version. Your analyses will now use only the cases that meet the filter condition.
For additional technical reference, you can review IBM SPSS Statistics documentation and university SPSS learning resources such as UCLA IDRE SPSS resources for broader SPSS workflow guidance.
How to Filter Data in SPSS Using a Filter Variable
A filter variable is one of the safest ways to filter cases in SPSS. It usually uses simple coding:
- 1 = included in analysis
- 0 = filtered out
This method makes the filtering rule visible. It also helps you check the sample size, label the rule, and report the filtering process clearly in your dissertation or research paper.
Suppose you want to analyze only respondents who completed the survey and belong to the treatment group.
Assume your variables are:
- completed: 1 = completed, 0 = not completed
- group: 1 = treatment, 2 = control
Use this SPSS syntax:
COMPUTE filter_treatment_complete = (completed = 1 AND group = 1).
VARIABLE LABELS filter_treatment_complete 'Filter: completed treatment group cases'.
VALUE LABELS filter_treatment_complete 0 'Filtered out' 1 'Included'.
FILTER BY filter_treatment_complete.
EXECUTE.
The first line creates a new filter variable. SPSS checks each row and gives it a value of 1 if the respondent completed the survey and belongs to the treatment group. Otherwise, SPSS gives the row a value of 0.
The second line adds a clear variable label. This helps you recognize the filter later.
The third line labels the values, so 0 and 1 are easy to interpret.
The fourth line activates the filter.
The fifth line runs the command.
After applying the filter, run a frequency table:
FREQUENCIES VARIABLES = filter_treatment_complete.This confirms how many cases are included and how many are filtered out.
How to Filter Data in SPSS Without Deleting Cases
The safest way to filter data in SPSS is to use a temporary filter instead of deleting unselected cases. This matters because some cases may be invalid for one analysis but useful for another.
For example, a respondent may have missing values on a satisfaction scale but complete values for age, gender, and treatment group. If you delete the case completely, you lose useful information for other analyses. However, if you filter the case only for the scale analysis, you preserve the dataset.
Use filtering when:
- You need temporary exclusion.
- You want to preserve the original dataset.
- You need different samples for different analyses.
- You want to document your inclusion rule.
- You are preparing dissertation or thesis results.
Use deletion only when you are certain that cases should not remain in the working file. Even then, save a backup first.
How to Filter Cases with Missing Data in SPSS
Missing data can affect analysis quality. Therefore, you may need to filter cases based on the number of valid responses.
Suppose you have a 10-item questionnaire named q1 to q10. Your rule is that a participant must answer at least 8 items to enter the scale-level analysis.
Use this syntax:
COMPUTE valid_items = NVALID(q1 TO q10).
COMPUTE filter_scale_complete = (valid_items >= 8).
VARIABLE LABELS valid_items 'Number of valid responses from q1 to q10'.
VARIABLE LABELS filter_scale_complete 'Filter: at least 8 valid scale items'.
VALUE LABELS filter_scale_complete 0 'Filtered out' 1 'Included'.
FILTER BY filter_scale_complete.
EXECUTE.
This method protects your dataset because it filters cases only for the relevant scale analysis. In addition, it allows you to explain your missing data rule clearly in the methodology or results chapter.
You can also use this approach before reliability analysis, composite score creation, regression, or group comparison tests. However, always document the rule you used.
How to Turn Off a Filter in SPSS
Turning off a filter is essential. If you forget to turn off a filter, later analyses may use the wrong sample.
To turn off a filter through the menu, use:
Data > Select Cases > All cases > OK
To turn off a filter using syntax, use:
FILTER OFF.
USE ALL.
EXECUTE.
FILTER OFF deactivates the filter. USE ALL tells SPSS to return to all cases. EXECUTE runs the command.
After turning off the filter, check your sample size again. You can run frequencies or descriptives to confirm that SPSS is using the expected number of cases.
A good practice is to place this syntax before each new analysis section:
FILTER OFF.
USE ALL.
EXECUTE.
This reduces the risk of carrying an old filter into a new analysis.
How to Check Whether a Filter Is Active in SPSS
You should always confirm whether a filter is active before interpreting output. This step prevents wrong sample sizes and misleading results.
Common signs of an active filter include:
- Crossed-out or marked case numbers in Data View
- A visible filter variable in the dataset
- Smaller sample size in the output
- Frequencies showing fewer valid cases than expected
- Syntax containing
FILTER BY - Results that use a subgroup instead of the full sample
For example, your dataset may contain 250 cases, but your frequency table may show only 180 valid cases. This may be correct if the filter was intentional. However, it may be a mistake if you forgot to turn the filter off.
Therefore, always check your active filter before running final analysis, exporting tables, or writing results.
How Filtering Data in SPSS Affects Analysis
Filtering changes the active sample size. When a filter is active, SPSS analyzes only the cases included by the filter rule. As a result, the output may show different means, percentages, p-values, confidence intervals, and regression coefficients.
SPSS Procedures Affected by Filtering
Filtering can affect:
- Frequencies
- Descriptive statistics
- Crosstabs
- T-tests
- ANOVA
- Correlation
- Regression
- Chi-square tests
- Reliability analysis
- Nonparametric tests
- Some saved statistics and output tables
For example, if you filter only treatment-group participants, your regression results describe the treatment group only. They do not describe the full sample.
Filtering Can Change Test Results
Filtering is not wrong when it matches your research question. However, it becomes a problem when the filter is accidental or undocumented.
For example, if your full dataset has 300 participants but your regression uses only 140 because of an old filter, your results may not answer the intended research question. Therefore, always check the active sample before interpreting output.
Filtering Is Not the Same as Editing Data
Filtering controls which cases enter analysis. It does not automatically control data transformations. If you compute a new variable, SPSS may apply the computation to all cases unless you use conditional logic.
Because of this, separate these tasks:
- Filtering cases for analysis
- Computing or recoding variables
- Deleting or restructuring data
This distinction helps you avoid unintended data changes.
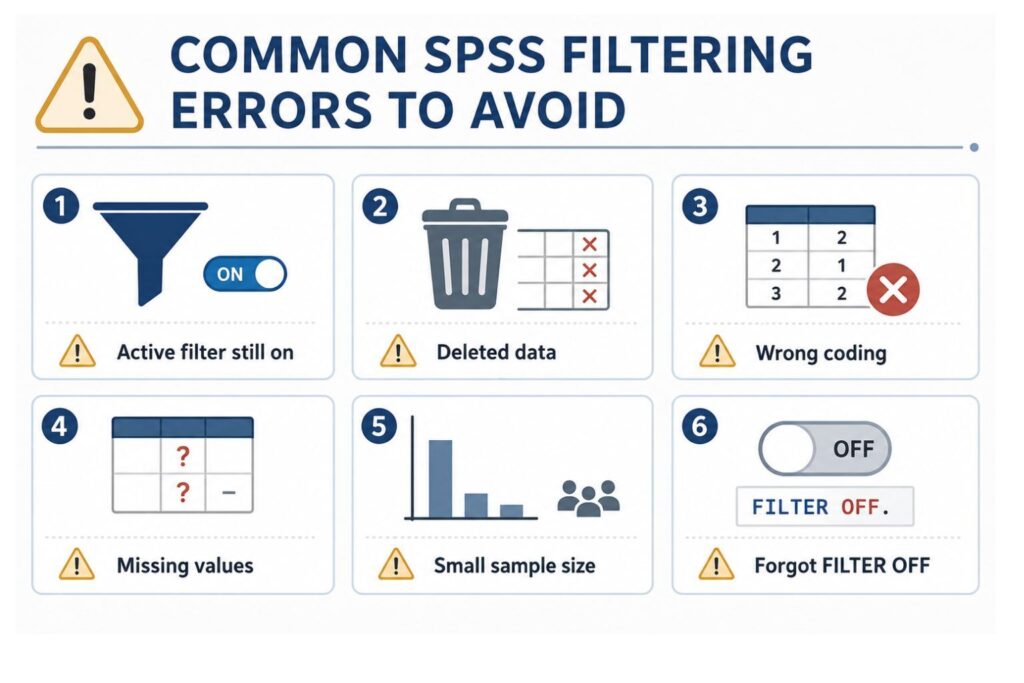
Common Mistakes When You Filter Data in SPSS
Many SPSS filtering problems come from small mistakes. The most common mistake is forgetting to turn the filter off. A student may filter completed surveys, run descriptive statistics, and later run regression without realizing the same filter is still active.
Another serious mistake is deleting unselected cases instead of filtering them. If you select “Delete unselected cases,” SPSS removes cases from the working dataset. If you save the file, you may not recover those rows unless you have a backup.
Common mistakes include:
- Forgetting to turn the filter off
- Deleting unselected cases instead of filtering them
- Using the wrong value coding
- Filtering on string values with spelling errors
- Filtering out missing values unintentionally
- Running analysis with the wrong active filter
- Assuming filtered rows have been deleted
- Reporting results without explaining the filtered sample
- Applying several filter variables without documentation
- Confusing filtering with weighting or Split File
To avoid these errors, save a backup, label your filter variable, run frequencies, check your sample size, and save your syntax.
Filtering vs Weighting vs Splitting Files in SPSS
Filtering, weighting, splitting files, and selecting cases are different SPSS tools. Each one answers a different question.
Use Filter when asking: “Which cases should enter this analysis?”
Use Weight Cases when asking: “How much should each case count?”
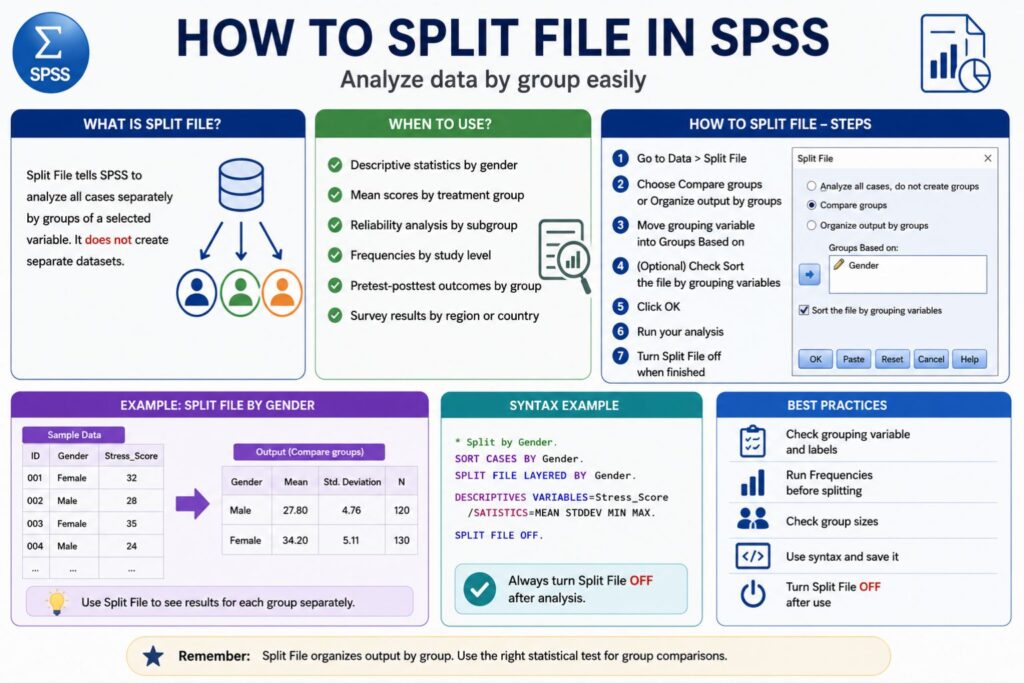
Use Split File when asking: “How can I run the same analysis separately by group?”
Use Select Cases when asking: “Should I filter, delete, copy, sample, or select a range of cases?”
Filtering tells SPSS to analyze only cases that meet a condition. Weighting changes how much each case contributes. Split File creates separate output for groups. Select Cases is the broader tool that includes filtering and other options.
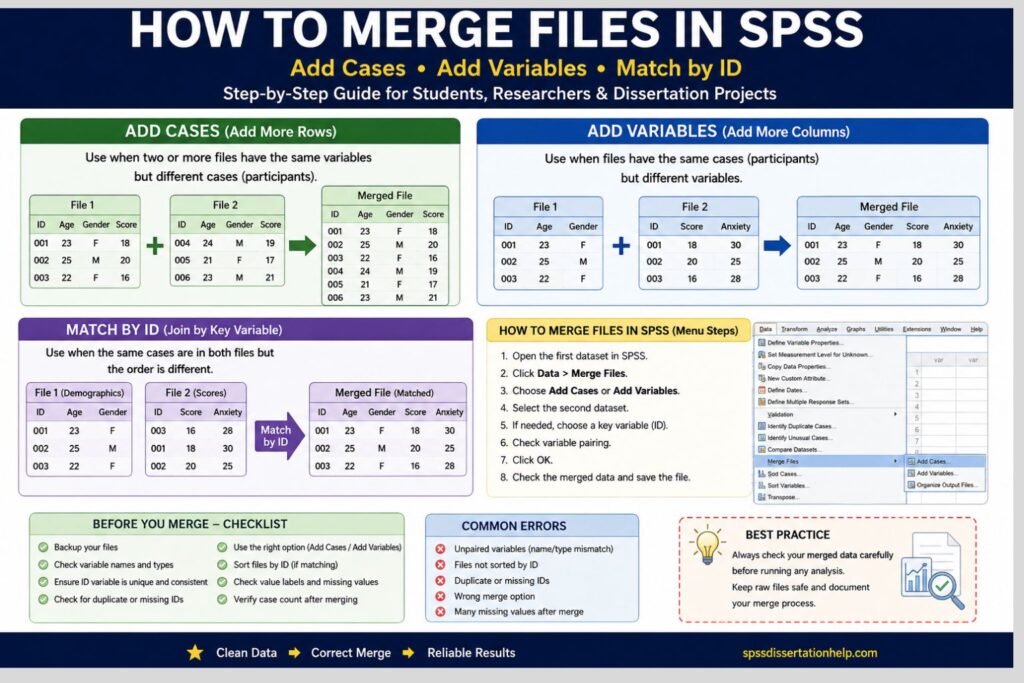
If your dataset needs broader preparation, read our related guides on how to clean data in SPSS, how to split file in SPSS, and how to merge files in SPSS.
SPSS Filter Syntax Examples
Syntax helps you document your filtering decisions. It also allows you to repeat the same filter later without guessing what you clicked in the menu.
1. Filter Age 18 and Above
COMPUTE filter_adults = (age >= 18).
VARIABLE LABELS filter_adults 'Filter: respondents aged 18 and above'.
VALUE LABELS filter_adults 0 'Filtered out' 1 'Included'.
FILTER BY filter_adults.
EXECUTE.
Use this when your study includes adults only.
2. Filter Completed Surveys Only
COMPUTE filter_completed = (completed = 1).
VARIABLE LABELS filter_completed 'Filter: completed survey responses only'.
VALUE LABELS filter_completed 0 'Filtered out' 1 'Included'.
FILTER BY filter_completed.
EXECUTE.
Use this when incomplete surveys should not enter analysis.
3. Filter Treatment Group Only
COMPUTE filter_treatment = (group = 1).
VARIABLE LABELS filter_treatment 'Filter: treatment group only'.
VALUE LABELS filter_treatment 0 'Filtered out' 1 'Included'.
FILTER BY filter_treatment.
EXECUTE.
Use this for treatment-group analysis.
4. Filter Female Respondents Only
COMPUTE filter_female = (gender = 2).
VARIABLE LABELS filter_female 'Filter: female respondents only'.
VALUE LABELS filter_female 0 'Filtered out' 1 'Included'.
FILTER BY filter_female.
EXECUTE.
Before using this syntax, confirm how gender is coded in your dataset.
5. Filter Cases With No Missing Outcome Value
COMPUTE filter_outcome_complete = NOT MISSING(outcome_score).
VARIABLE LABELS filter_outcome_complete 'Filter: nonmissing outcome score'.
VALUE LABELS filter_outcome_complete 0 'Filtered out' 1 'Included'.
FILTER BY filter_outcome_complete.
EXECUTE.
Use this before analyses that require a valid outcome variable.
6. Filter Cases With at Least 80% Complete Scale Items
If a 10-item scale requires at least 8 completed responses, use:
COMPUTE valid_scale_items = NVALID(q1 TO q10).
COMPUTE filter_80_complete = (valid_scale_items >= 8).
VARIABLE LABELS filter_80_complete 'Filter: at least 80 percent complete scale items'.
VALUE LABELS filter_80_complete 0 'Filtered out' 1 'Included'.
FILTER BY filter_80_complete.
EXECUTE.
This is helpful for questionnaire and survey analysis.
7. Filter by Two Conditions
COMPUTE filter_adult_completed = (age >= 18 AND completed = 1).
VARIABLE LABELS filter_adult_completed 'Filter: adults with completed surveys'.
VALUE LABELS filter_adult_completed 0 'Filtered out' 1 'Included'.
FILTER BY filter_adult_completed.
EXECUTE.
Use this when inclusion depends on more than one rule.
8. Turn Filter Off
FILTER OFF.
USE ALL.
EXECUTE.
Run this before moving from subgroup analysis back to full-sample analysis.
How to Report Filtered SPSS Results in a Dissertation
You should report filtering clearly in your methods, data screening, or results chapter. Readers need to know which cases entered the analysis and why.
Report these details:
- Original sample size
- Filtered sample size
- Inclusion rule
- Exclusion rule
- Reason for filtering
- Whether cases were temporarily filtered or permanently deleted
Example 1:
“Analysis was restricted to participants aged 18 years and above using an SPSS filter variable coded 1 for eligible cases and 0 for ineligible cases.”
Example 2:
“Cases with fewer than 8 valid responses on the 10-item scale were excluded from scale-level analysis using a temporary SPSS filter.”
Example 3:
“The original dataset was retained, and filtered cases were excluded only from the relevant analyses.”
Example 4:
“Before regression analysis, the dataset was filtered to include only participants with nonmissing values for the dependent variable and all main predictors.”
Clear reporting protects your work because it shows that the sample size was intentional, not accidental.
SPSS Filtering Help and Pricing
SPSS filtering may look simple, but one wrong rule can change the entire analysis. For example, if you filter the wrong group, exclude valid cases, or forget to turn off an active filter, your output may show the wrong sample size and misleading results.
Our SPSS filtering and data preparation support helps students and researchers avoid incorrect filtering rules, deleted data, missing data problems, and confusing output.
Pricing depends on dataset size, number of variables, deadline, and analysis complexity.
- Basic SPSS filtering and data screening: from $10 per page
- SPSS data cleaning and variable preparation: from $15 per page
- SPSS analysis with tables and interpretation: from $20 per page
- Full dissertation data analysis chapter support: custom quote
- Urgent SPSS help: available at a higher rate depending on deadline
To request a quote, send your SPSS file, research questions, variables, assignment instructions, and deadline. We will review the scope and provide a clear price estimate before work begins.
Our goal is to help you avoid wrong sample sizes, incorrect filtering rules, deleted data, and unreliable SPSS results.
Why Trust Our SPSS Dissertation Help?
You need more than SPSS output. You need accurate preparation, correct analysis, clear interpretation, and results that match your research questions.
Our SPSS support covers dissertation, thesis, capstone, coursework, and research projects. We help with data cleaning, filtering, coding, variable preparation, missing data screening, statistical analysis, APA-style tables, and interpretation.
We can support common SPSS procedures such as:
- Descriptive statistics
- Frequencies
- Crosstabs
- Chi-square tests
- Independent-samples t-tests
- Paired-samples t-tests
- ANOVA
- Correlation
- Regression
- Reliability analysis
- Nonparametric tests
In addition, we help you understand what was done, why it was done, and how to report it correctly. This matters because many students can generate output but struggle to explain the sample, method, assumptions, and results.
Your data is handled confidentially. We focus on clear communication, accurate analysis, and practical guidance that helps you move from dataset problems to report-ready results.
Need Help Filtering Data in SPSS?
If you are not sure how to filter data in SPSS, do not guess. A wrong filter can change your sample size, test results, p-values, and final interpretation.
We can help with:
- SPSS data filtering
- Select Cases support
- Missing data screening
- Variable coding
- Data cleaning
- SPSS analysis
- APA results tables
- Dissertation Chapter 4 support
- Output interpretation
- Revision support where needed
Contact spssdissertationhelp.com today for expert SPSS help and get your dataset filtered, cleaned, analyzed, and interpreted correctly.
FAQs About How to Filter Data in SPSS
Filtering data in SPSS means temporarily excluding some cases from analysis while keeping them in the dataset. SPSS analyzes included cases and ignores filtered-out cases until you turn off the filter.
No. Filtering does not delete data when used correctly. It excludes cases from analysis but keeps them in the dataset. However, if you choose “Delete unselected cases” under Select Cases, SPSS can remove cases from the working dataset.
Use the menu path:
Data > Select Cases > All cases > OK
You can also use syntax:FILTER OFF.
USE ALL.
EXECUTE.
Always turn off a filter before returning to full-sample analysis.
Rows may appear crossed out or marked because they are filtered out. These cases remain in the dataset, but SPSS excludes them from analysis while the filter is active.
Yes. You can create a filter using multiple conditions. For example, you can include only respondents aged 18 and above who completed the survey:COMPUTE filter_include = (age >= 18 AND completed = 1).
FILTER BY filter_include.
EXECUTE.
A filter variable tells SPSS which cases to include or exclude. It is usually coded 1 for included cases and 0 for filtered-out cases. A clear 0/1 filter variable is easier to verify and report.
Filtering is the active process of excluding cases from analysis without deleting them. Selecting Cases is the broader SPSS menu workflow that can filter cases, delete unselected cases, copy cases, select random samples, or select case ranges.
Check Data View for marked case numbers, inspect the active filter variable, and compare your output sample size with the full dataset. You can also check your syntax for FILTER BY.
Yes. Filtering changes which cases enter the analysis. Therefore, it can change sample size, means, percentages, test statistics, p-values, confidence intervals, and regression coefficients.
Filtering is usually safer when you need temporary exclusion. Deleting cases should only be done when you are certain those cases should not remain in the working dataset and you have saved a backup copy.
Final Takeaway
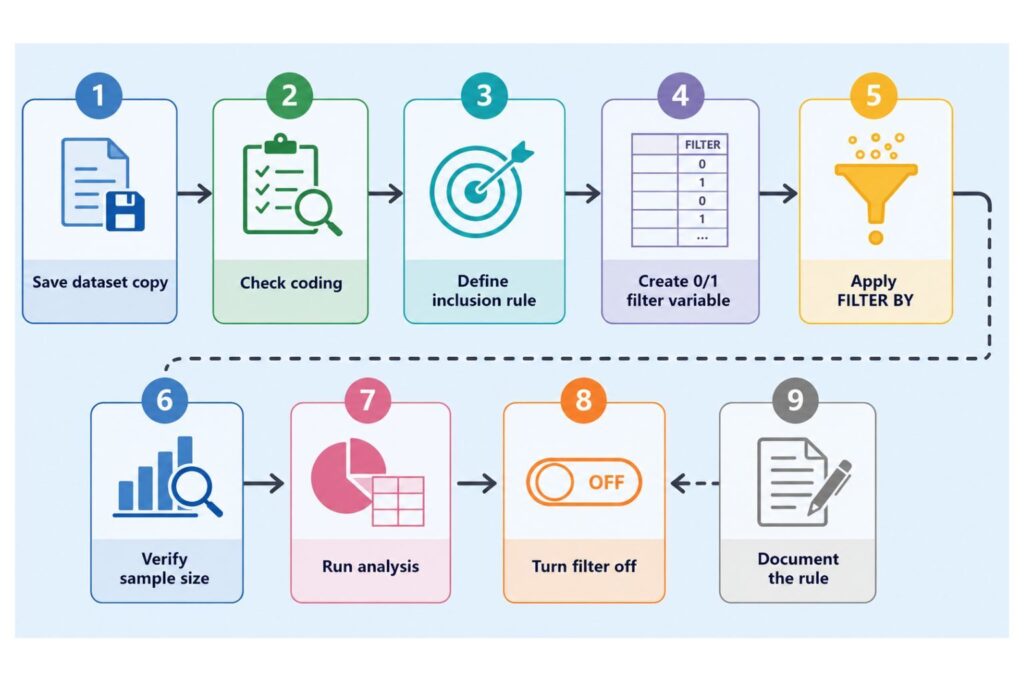
Knowing how to filter data in SPSS helps you analyze the right cases without damaging your original dataset. The safest approach is to define your inclusion rule, create a clear 0/1 filter variable, verify the sample size, save your syntax, run the analysis, and turn the filter off when finished.
For dissertation and research work, filtering should always be documented. Your reader should know why cases were included or excluded, what sample size was analyzed, and whether the original data was preserved.
If you need help filtering data, cleaning variables, preparing your dataset, running SPSS analysis, or interpreting output, contact spssdissertationhelp.com for expert SPSS dissertation help.